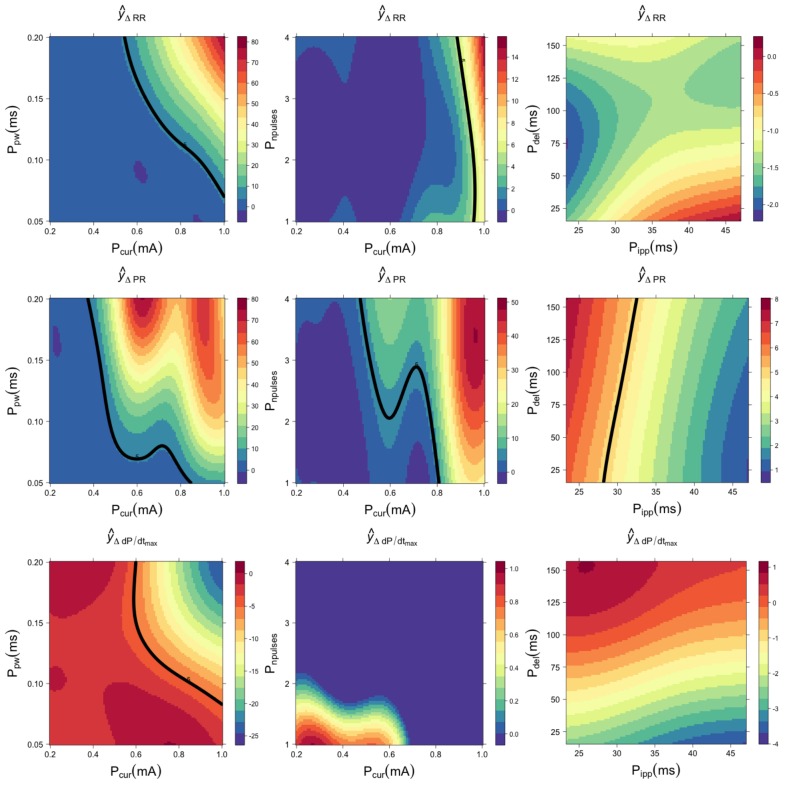
Fig 3. Cardiac responses to different combinations of VNS parameters, estimated with a Gaussian process regression for sheep 1.
The chronotropic (), dromotropic () and inotropic () responses are shown in the first, second and third rows, respectively. Note the different scales of each colormap. The continuous black line represents a reference threshold of 5% variation with respect to the baseline value.

