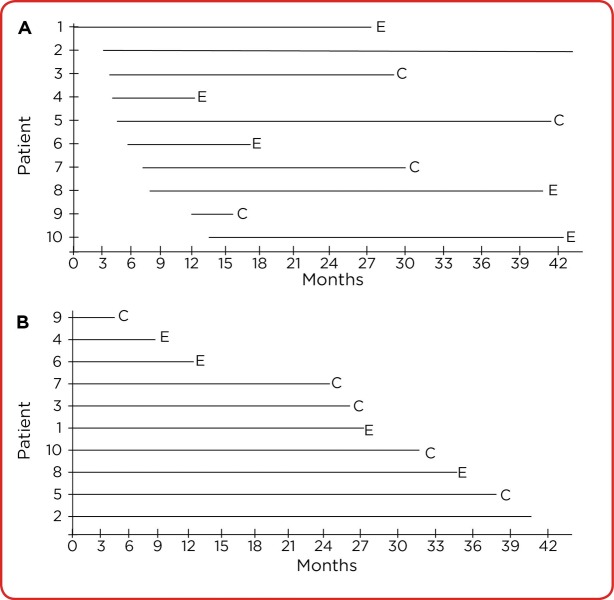
Figure 1.
(A) Hypothetical first patients assigned to arm A as they sequentially enter the study. Each patient’s serial time (on study) ends with an E (for death in this example) or a C (for censored). If the data analysis is completed at the end of the period marked by the right border of the x-axis, all patients who have not died or already been censored are censored at that point. (B) The same hypothetical patients are arranged from shortest to longest serial time before K-M analysis, allowing us to see the initial intervals that will be graphed on the horizontal (time) axis.

