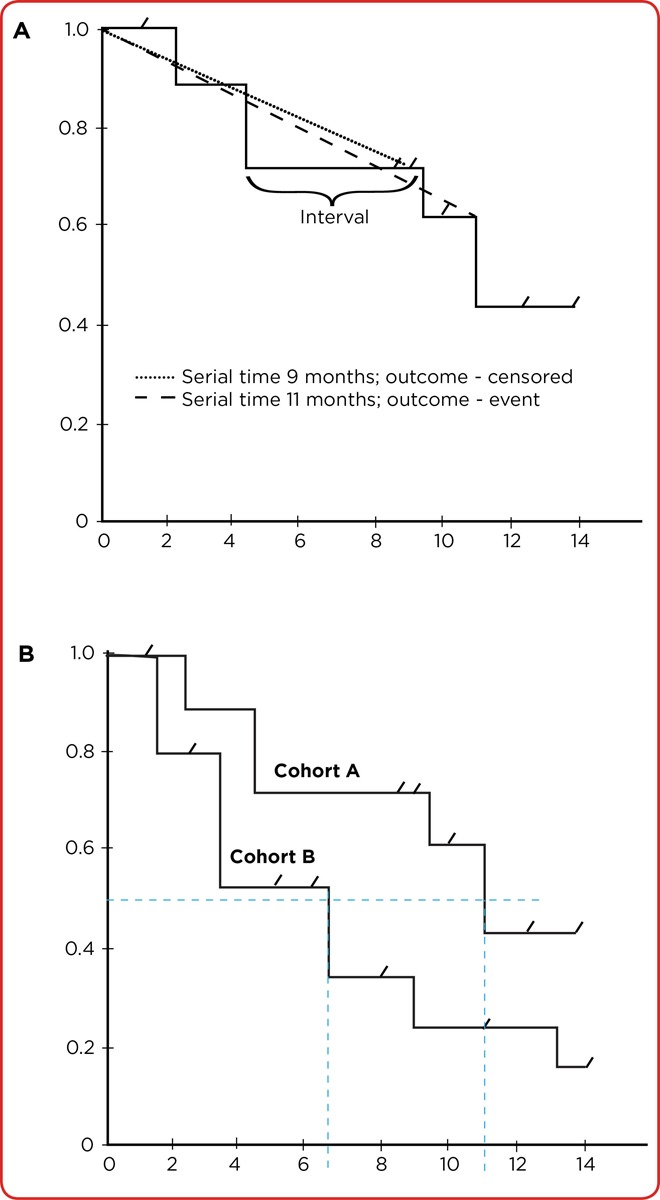
Figure 2.

(A) A hypothetical Kaplan-Meier curve of one cohort (arm). Each horizontal portion is the interval between the studied event between one and the next subject in that arm. Only the event influences the interval length, whereas tick marks indicate censored subjects. (B) Median survival (from experiencing the studied event) can be estimated in both arms by drawing a line on the y-axis at 0.5 (50%). Locating the point at which each intersects 0.5 shows median survival is approximately 6.5 months in cohort B and 11 months in cohort A.
