. 2016 Sep 7;5:e15477. doi: 10.7554/eLife.15477

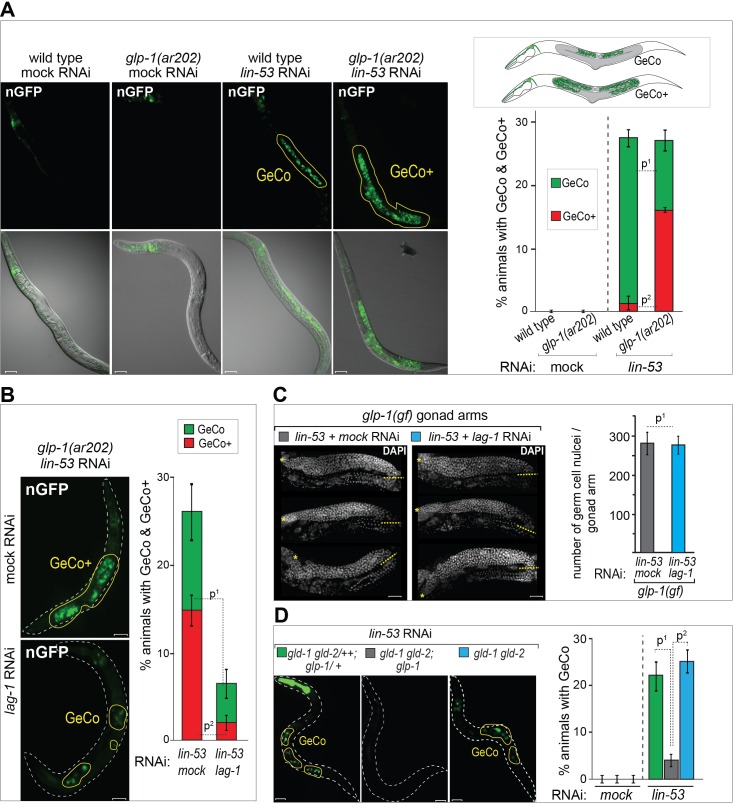
Figure 1. GLP-1Notch signaling promotes reprograming of germ cells.

(A) GLP-1Notch enhances germ cell conversion (GeCo) into neuronal-like cells. Left: Fluorescent (top) and combined fluorescent/differential interference contrast (DIC) micrographs (bottom) of adult animals. All animals ectopically expressed the pro-neuronal transcription factor CHE-1 from a heat-shock promoter. glp-1(ar202) is a temperature-sensitive gain-of-function allele of the Notch receptor. Animals were subjected to either mock (control) or lin-53 RNAi. Reprogrammed cells expressed a GFP reporter driven from the neuronal gcy-5 promoter (here an in other figures nGFP) and are outlined here and elsewhere in yellow. Any signal outside the outlined region comes from somatic tissues. GeCo+ indicates animals that displayed a strongly enhanced GeCo phenotype. Scale bars = 10 μm. The cartoons depicting the GeCo and GeCo+ phenotypes are on the top right. The gonads are shaded in grey and GFP-positive converted germ cells are green. Fractions of animals displaying GeCo and GeCo+ are indicated below. At least 250 animals were quantified per condition. P-values were calculated using Student's t-test: p1<0,0001; p2=0,0006. Error bars represent SEM. (B) The transcriptional effector of the GLP-1Notch signaling pathway, LAG-1, is required for the GLP-1Notch–mediated enhancement of GeCo. Left: Fluorescent micrographs of adults expressing CHE-1–induced nGFP as explained above. GeCo is diminished upon the depletion of LAG-1. White dashed lines outline the animal body. Scale bars = 10 μm. Right: The corresponding quantifications. At least 400 animals were quantified per condition. P-values were calculated using Student's t-test: p1<0,0001; p2=0,0018. Error bars represent SEM. (C) GLP-1Notch signaling enhances GeCo independently from germ cell proliferation. Shown are DAPI-stained gonads of glp-1(ar202) animals, expressing CHE-1–induced nGFP, treated with either mock or lin-53 RNAi. Germ cells were counted from the DTC (yellow asterisk) to the turn of the gonad arm (dashed yellow line). 15 gonad arms per condition were counted. Scale bars = 10 μm. Quantifications are on the right. While greatly inhibiting GeCo, lag-1 RNAi did not change the number of germ cells. P-values were calculated using Student's t-test: p1=0,89. Error bars represent SEM. (D) GLP-1Notch enhances GeCo independently from proliferation. Left: Fluorescent micrographs of adults (with indicated genotypes), expressing CHE-1–induced nGFP. The first panel on the left shows a control, heterozygous (wild-type) gld-1 gld-2/++; glp-1/+ animal. The other panels show the homozygous gld-1(q497) gld-2(q485) mutants, carrying either a loss-of-function (q175, center) or a wild-type (right) allele of glp-1. Despite proliferating, germ cells in the gld-1 gld-2; glp-1 gonads have lost the ability to undergo GeCo. Scale bars = 10 μm. Right: the corresponding quantifications. At least 250 animals were quantified per condition. P-values were calculated using Student's t-test: p1=0,0478; p2=0,0201. Error bars represent SEM.

DOI: http://dx.doi.org/10.7554/eLife.15477.003

Figure 1—source data 1. Quantification of GeCo in glp-1(gf) and lag-1 RNAi animals.
(A) Quantification of GeCo+ phenotype upon RNAi against lin-53 in glp-1(ar202) mutants. (B) Quantification of GeCo dependency on LAG-1. (C) Quantification of germ cells in glp-1 (ar202) gonads with our without lag-1 RNAi treatment. (D) Quantification of GeCo in different genetic backgrounds with highly proliferative germlines upon RNAi against lin-53. Figure 1—figure supplement 1A source data: Quantification of gfp-positive germ cells. Figure 1—figure supplement 2 source data: Quantification of germ cells in different genetic backgrounds with highly proliferative germlines. Figure 1—figure supplement 3A source data: Quantification of GeCo after cell cycle block with HU treatment. More details can be found in the corresponding figure legends.
DOI: 10.7554/eLife.15477.004

Figure 1.

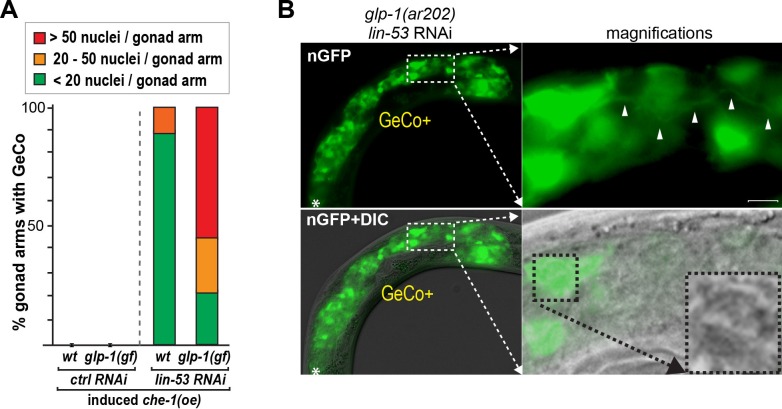
Figure 1—figure supplement 1. glp-1(gf) gonads contain more than twice the number of converted cells which display neuronal characteristics.

Figure 1—figure supplement 1.

(A) For the quantification of gcy-5::gfp-positive cells per gonadal arm only the GeCo category of wt vs. glp-1(gf) was used because GeCo+ animals already show an extensive area of the gonad filled with gcy-5::gfp-positive cells with usually >100 cells/gonad making reliable counting impossible. Notably, animals with a seemingly similar extend of GeCo in wt vs. glp-1(gf) show a clear increase of gcy-5::gfp-positive cells per gonadal arm from approx. 10 in wt to > 30 in glp-1(gf). n(wt) = 75 gonaldal arms, n (glp-1(ar202)) = 221 gonadal arms. The background of the loss of function allele glp-1(q175) leads to a significant decrease in GeCo as shown previously (Tursun et al., 2011). (B) A magnified view of gcy-5::gfp-positive (nGFP) cells, in a GeCo+ gonad from a glp-1(gf) animal. The converted cells show axo-dendritic projections (white arrow heads). The inset in the corresponding DIC image, magnified in the right-bottom corner, shows the nuclear morphology of a converted germ cell, which has lost the germ cell-specific ‘fried-egg’-like shape and instead shows nuclear speckles characteristic of a neuronal cell. Scale bar = 1 μm.
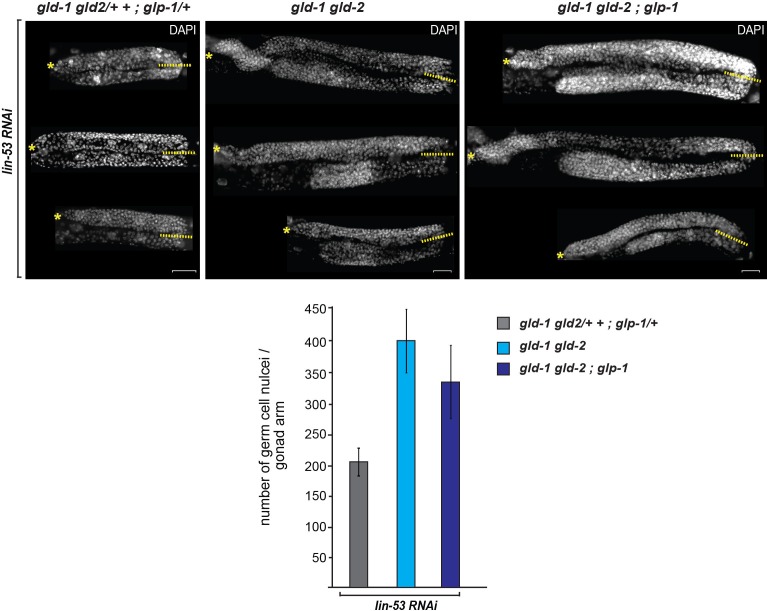
Figure 1—figure supplement 2. Germ cell numbers are similar between gld-1 gld-2 double and gld-1 gld-2; glp-1 triple mutants.

Figure 1—figure supplement 2.

DAPI-stained gonads of gld-1(q497) gld-2(q485) or gld-1(q497) gld-2(q485); glp-1(q175) mutants, carrying the hsp::che-1 and gcy-5::gfp transgenes. The gonads were imaged by fluorescent microscopy using Z-stack acquisitions. Germ cells from the DTCs (yellow asterisks) to the turn of the gonad arm (dashed lines) were counted. Below:15 gonad arms per condition of L4 animals were counted. The numbers of germ cells differ only slightly (15%) in the double mutant vs. triple mutants background. Scale bars = 10 μm. Error bars represent SEM.
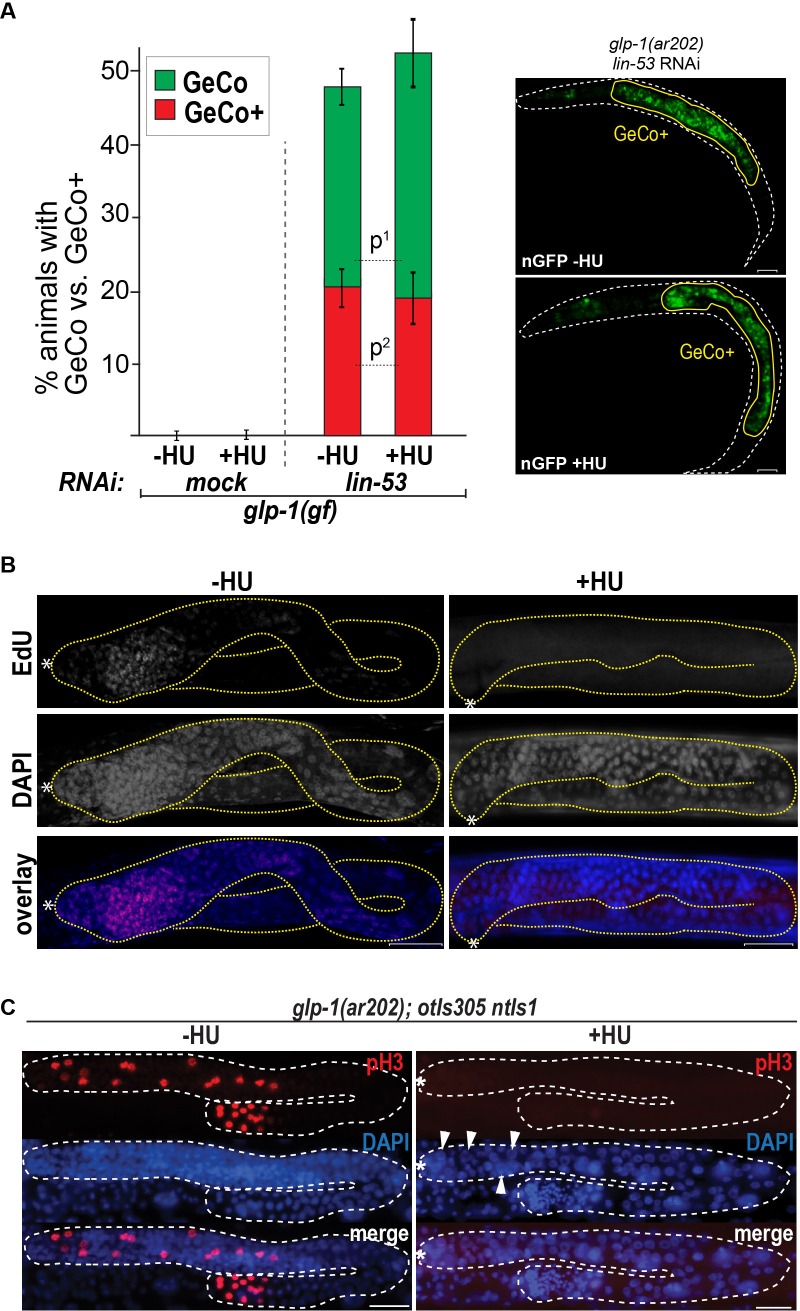
Figure 1—figure supplement 3. Blocking the cell cycle with hydroxyurea does not inhibit GeCo+.

Figure 1—figure supplement 3.

(A) We used hydroxyurea (HU) treatment for 5 hr to chemically block the cell cycle, which makes germ cells arrest in the S phase of the cell cycle. This arrest does not diminish the GeCo+ phenotype in glp-1(gf) gonads upon lin-53 RNAi and che-1(oe). At least 150 animals were quantified per condition. P-values were calculated using Student's t-test: p1=0,1409; p2=0,4583. Error bars represent SEM. The right panel shows examples of GeCo+ displaying animals based on gcy-5::gfp (nGFP) for HU-untreated (-HU) and HU-treated (+HU) animals. (B) The gonads were stained for EdU incorporation. Dashed lines outline gonads. Asterisks indicate distal tips of gonads. Scale bars = 10 μm. (C) The gonads of glp-1(ar202) gf animals, which were treated with HU for 12 hr and stained with DAPI and H3Ser10ph (pH3) antibody. The pH3-positive cells indicate condensed chromosomes of dividing cells. After 12 hr of HU treatment, the gonads contained, as expected, enlargement nuclei (arrowheads) (Gartner et al., 2004; Fox et al., 2011). The loss of pH3-positive cells indicates a cell cycle arrest. Asterisks indicate distal tips of gonads, dashed lines outline gonad. Scale bars = 10 μm.