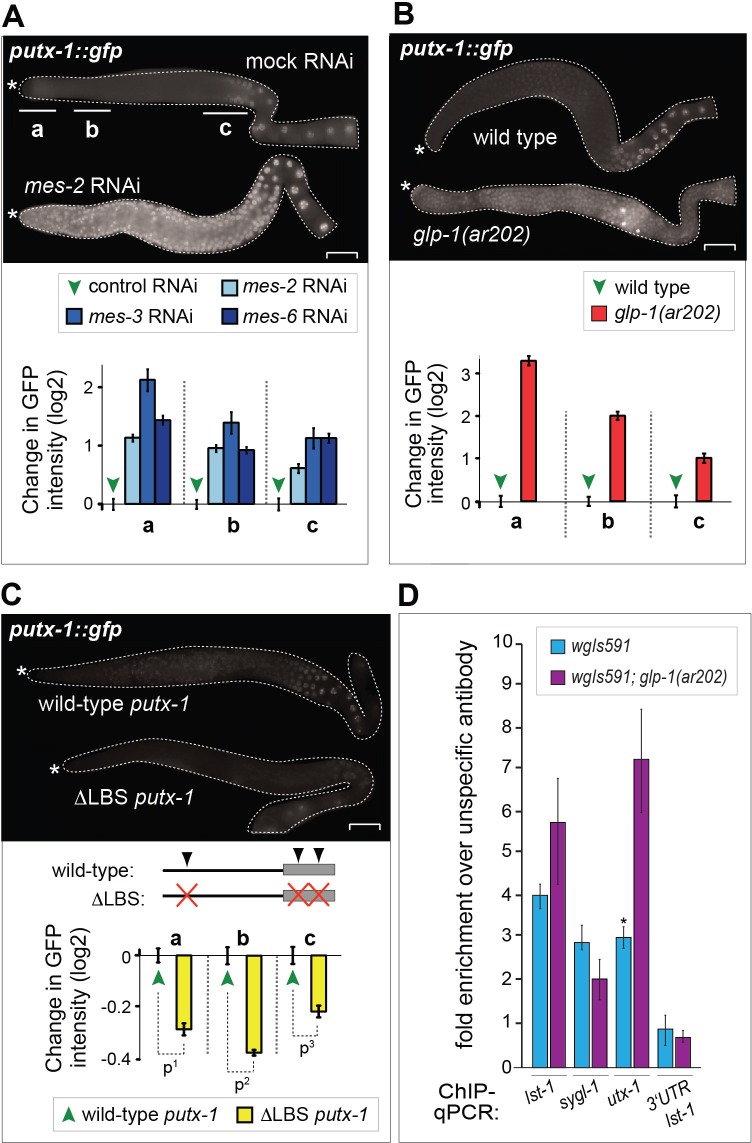
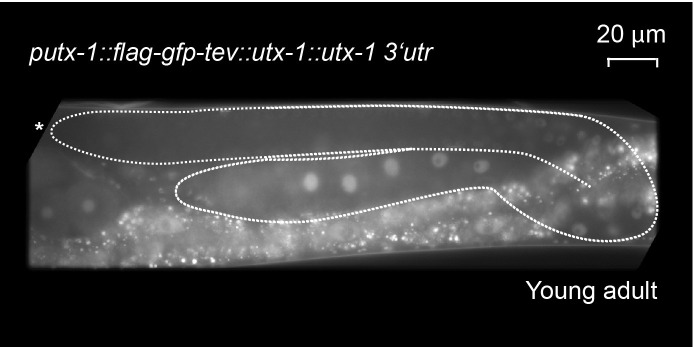
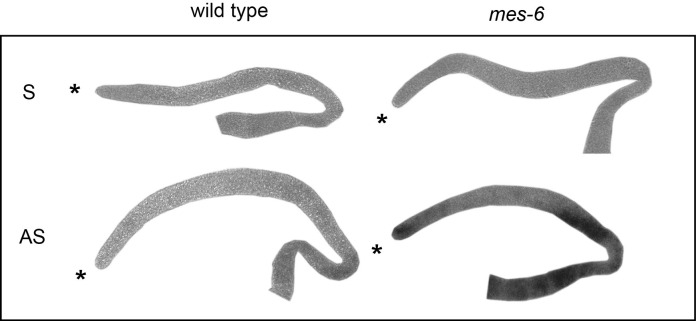
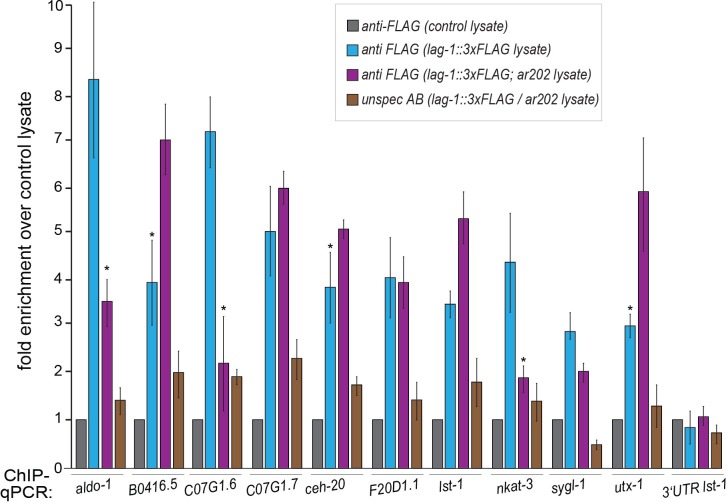
Figure 5. UTX-1 is regulated by GLP-1Notch and PRC2.
(A–C) Expression of utx-1 is regulated by PRC2 and GLP-1Notch. Top: dissected gonads expressing a GFP reporter, driven from the utx-1 promoter (putx-1::GFP, fused to histone 2B for nuclear localization to facilitate quantification), subjected to the indicated RNAi (A), crossed into the indicated genetic background (B) or carrying the indicated mutations in the reporter gene (C). a, b, and c indicate gonadal regions containing germ cells in mitosis (a), and leptotene/zygotene (b) or pachytene (c) stages of meiosis. Below: the corresponding GFP quantifications. The diagrams show GFP intensities relative to the control (indicated by green arrows) in regions a-c. Results are represented as average changes in the GFP intensity (relative to mock RNAi-ed or untreated animals). The error bars represent SEM. The numbers of analyzed gonads were as follows: n = 44 for wild-type reporter; n = 36 for glp-1(ar202); n = 55 for wild-type reporter on control RNAi; n = 48 for mes-2 (RNAi); n = 15 for mes-3 (RNAi); n = 29 for mes-6 (RNAi), and n = 20 for the LAG-1 binding sites deleted reporter. (A) The putx-1::GFP reporter is repressed by PRC2. In all mes-depleted gonads, the reporter was de-repressed in proliferating cells (a) as well as in more proximal gonadal regions (b-c). (B) The putx-1::GFP reporter is upregulated by GLP-1Notch. In the gain-of-function glp-1(ar202) mutant, the reporter was strongly derepressed in the proliferating cells in the distal-most gonad (a). Its expression was also increased in the more proximal regions (b-c), which, in this mutant background, contain proliferating cells instead of meiotic cells. (C) putx-1::GFP expression depends on the predicted LAG-1/CSL binding sites in the promoter. Upon deletion of putative LAG-1/CSL binding sites, the reporter expression was abolished. The changes in GFP intensities were highly significant (p-values were measured by independent t-tests) p1=4.85–13, p2=1.38–20, p3=1.18–7. (D) LAG-1 binds the utx-1 promoter. Lysates of animals expressing FLAG-tagged LAG-1 (strain wgIs591; lag-1::TY1::EGFP::3xFLAG), either in wild-type or glp-1(ar202) background, were subjected to ChIP-qPCR analysis of the indicated genes. Negative controls and additional tested genes are shown in Figure 5—figure supplement 3. The qPCR amplicons were tested in at least three independent experiments. The results are shown as fold enrichment in anti-FLAG IP compared to IP with unspecific antibody. The 3’UTR of lst-1 serves as a negative control. Interestingly, LAG-1 binding in the glp-1(ar202) gain-of-function background is stronger to the utx-1 promoter than to the reported GLP-1Notch targets lst-1 and sygl-1. The asterisk indicates a p-value < 0.05 (Students t-test). Error bars represent SEM.


