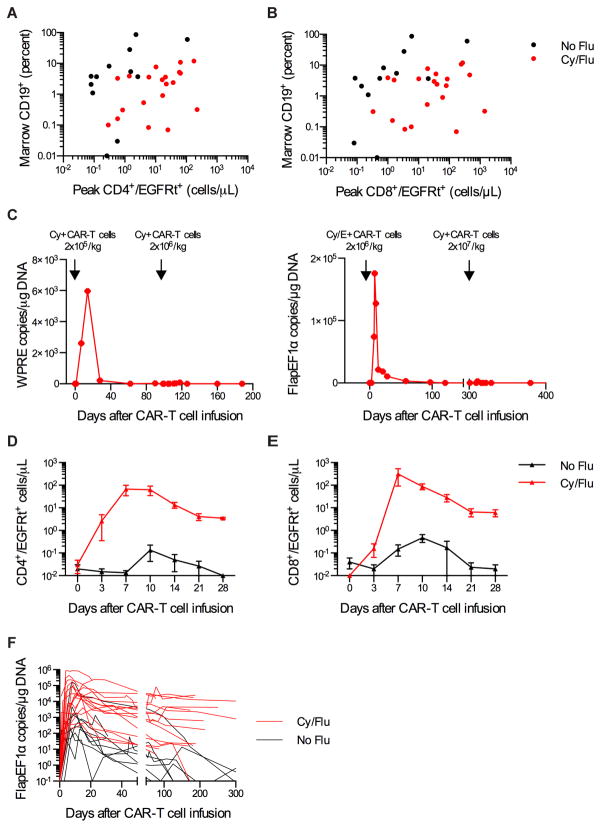
Fig. 2.
Increased CD19 CAR-T cell expansion and persistence after Cy/Flu lymphodepletion. AB) Peak CD4+/EGFRt+ (A) and CD8+/EGFRt+ (B) CAR-T cell numbers after the first CAR-T cell infusion in relation to the percentage of CD19+ cells (normal and malignant CD19+ B cells) in the bone marrow before lymphodepletion chemotherapy for each patient. C) CAR-T cell persistence in blood as integrated transgene copies/μg DNA in 2 patients who received a cycle of Cy or Cy/E lymphodepletion chemotherapy and CAR-T cell infusion followed by a second cycle of Cy lymphodepletion chemotherapy and CAR-T cell infusion. Integrated transgene copies were determined by QPCR for distinct sequences located in the WPRE or Flap/EF1α regions of the lentivirus. D–E) Mean+/−SEM CD4+/EGFRt+ (D) and CD8+/EGFRt+ (E) CAR-T cell counts in blood on the indicated days after CAR-T cell infusion for patients treated with 2×10⁷ EGFRt+ cells/kg after either Cy or Cy/E lymphodepletion (No Flu) or Cy/Flu lymphodepletion (Cy/Flu). F) CAR-T cell persistence in blood of patients who received Cy or Cy/E lymphodepletion (No Flu, black, n=9) compared to Cy/Flu lymphodepletion (red, n=18) is shown as FlapEF1α integrated transgene copies/μg DNA. CAR-T cell persistence data are truncated at the time of HCT for patients who underwent autologous or allogeneic HCT after CAR-T cell infusion.

