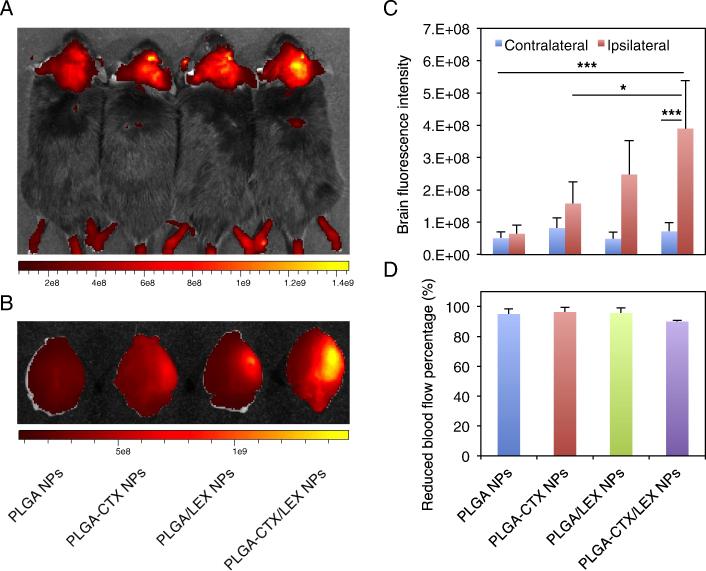
Figure 2.
Imaging of NPs in the ischemic brain. (A) Representative images of NPs in the brains of live animals. For each mouse, the head was shaved and the IR780 signal in the brain was acquired using an IVIS system 24 hours after intravenous administration of NPs (n = 3). (B) Representative images of NPs in the excised brains. (C) Semi-quantification of NPs in the excised brains. The intensity was quantified using Living Image 3.0. (D) Decrease of cerebral blood flow in mice before and during MCAO. All experiments were carried out in triplicate and the standard deviation is denoted using error bars. One-way ANOVA analysis was performed to determine the difference between groups. *p < 0.05. ***p < 0.001.

