Figure 3.
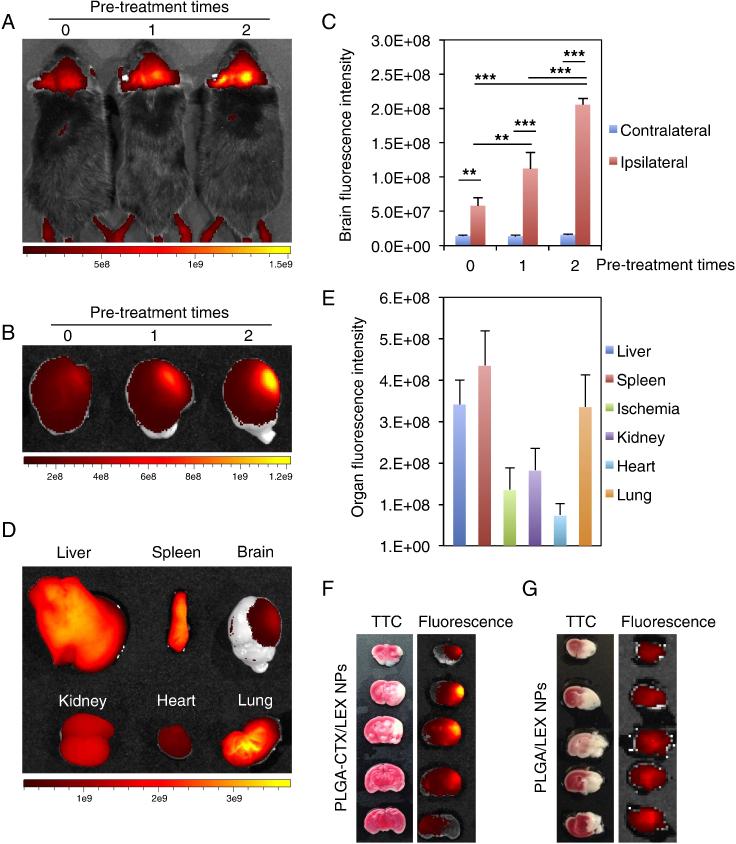
Autocatalytic delivery of NPs to the ischemic brain. (A-C) The efficiency of PLGA-CTX/LEX NPs autocatalytically increased with subsequent administrations. Prior to the administration of IR780-loaded NPs, mice were pre-treated with saline or unlabeled PLGA-CTX/LEX NPs for indicated times (n = 3). Twenty-four hours later, fluorescence signals in live mice (A) and in the excised brains (B) were determined using an IVIS imaging system and the fluorescence intensities in the brain were quantified (C). Qualitative (D) and quantitative (E) imaging of NPs in major organs isolated from mice receiving 2 treatments of unlabeled PLGA-CTX/LEX NPs prior to the final administration of IR780-loaded PLGA-CTX/LEX NPs. All experiments were carried out in triplicate and the standard deviation is denoted using error bars. Images B and D were automatically processed by the IVIS imaging system by superimposing fluorescence images with white field images. The scale bars show fluorescence intensities but not white field signals. (F) Representative images of brain slices prepared from mice receiving 2 treatments of unlabeled PLGA-CTX/LEX NPs prior to the final administration of IR780-loaded PLGA-CTX/LEX NPs. The left panel represents TTC staining and the right panel represents IR780 signal. (G) Representative images of brain slices prepared from mice receiving 2 treatments of unlabeled PLGA-LEX NPs prior to the final administration of IR780-loaded PLGA-LEX NPs. The left panel represents TTC staining and the right panel represents IR780 signal. One-way ANOVA analysis was performed to determine the differences between groups in Figure 3C. **P < 0.01. ***P < 0.001.

