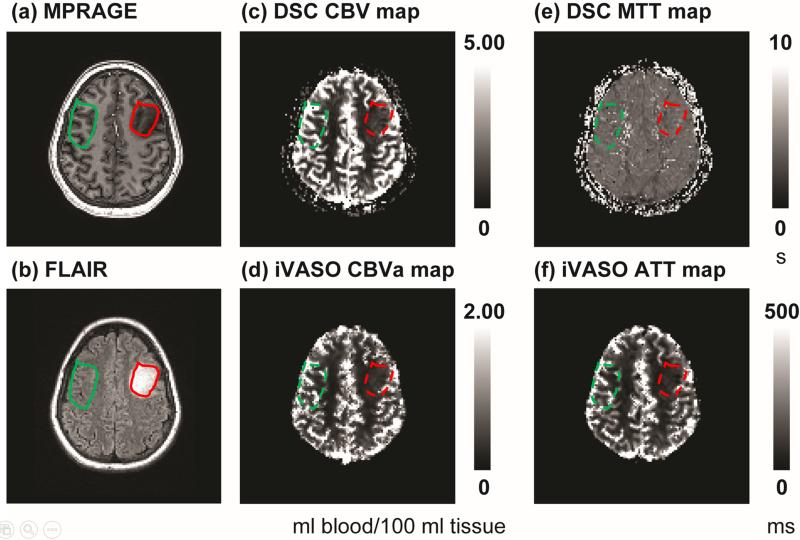
Figure 1.
Images from patient 14 (female, 21 years old, WHO grade II oligodendroglioma in the left frontal lobe). (a) MPRAGE, (b) FLAIR, (c) DSC CBV map, (d) iVASO CBVa map, (e) DSC MTT map, and (f) iVASO ATT map. Units: ml blood/100 ml tissue for CBV and CBVa, second (s) for MTT, and millisecond (ms) for ATT. Images after co-registration are shown. ROIs in the tumor (red) and contralateral (green) regions were first selected on MPRAGE and FLAIR images (solid line), and then projected onto DSC and iVASO images (dashed line). The contralateral ROIs were made slightly larger than the tumor ROIs, but only voxels from the GM masks in the contralateral regions were included for signal average. Thus, the total number of voxels were approximately the same between tumoral and contralateral ROIs. In iVASO images, the skull was excluded during the calculation of CBVa and ATT maps.

