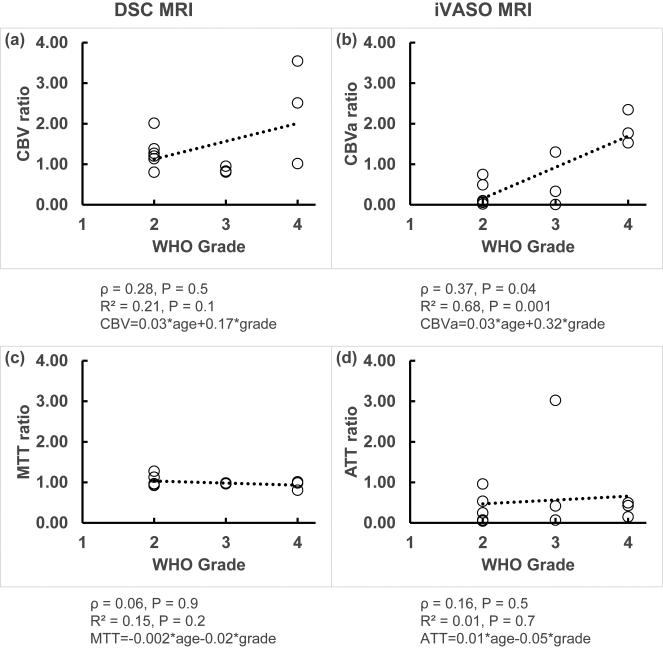
Figure 2.
Correlation analysis between the DSC and iVASO measures (ratio of tumor/contralateral) with WHO tumor grade. The open circles represent data points, and the trend lines from linear regression are shown with dotted lines. Spearman's rank correlation coefficient (ρ), adjusted R2 and the fitted equation from multiple regression, and P values are shown under each graph.

