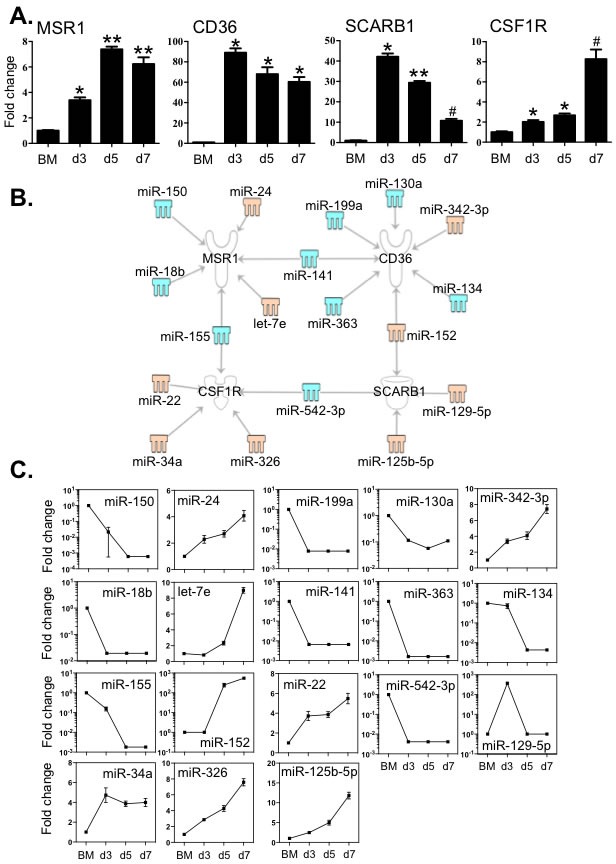
Figure 5. Expression levels of key macrophage receptors correlated with the expression of miRNAs that potentially target these transcripts.

A. Expression levels of MSR1, CD36, SCARB1 and CSF1R were determined by qPCR. B. Potential miRNAs targeting the 3′-UTR of MSR1, CD36, SCARB1 and CSF1R in BMDM cultures were identified by the TargetScan, and miRanda databases and IPA ingenuity system. Blue represents decreased expression of miRNAs, whereas yellow is for increased expressed miRNAs. C. The fold changes of potential regulating miRNAs were calculated based on the fluorescence index of each miRNA at different time-points, after normalization to that of the respective miRNAs in the control group (isolated bone marrow cells). Values are presented as mean ±SEM (n = 4~6), * P < 0.05 (vs. BM), ** P < 0.05 (vs. d3), # P < 0.05 (vs. other groups).
