
Figure 2. SAHA promotes ROS generation in H292 cells.
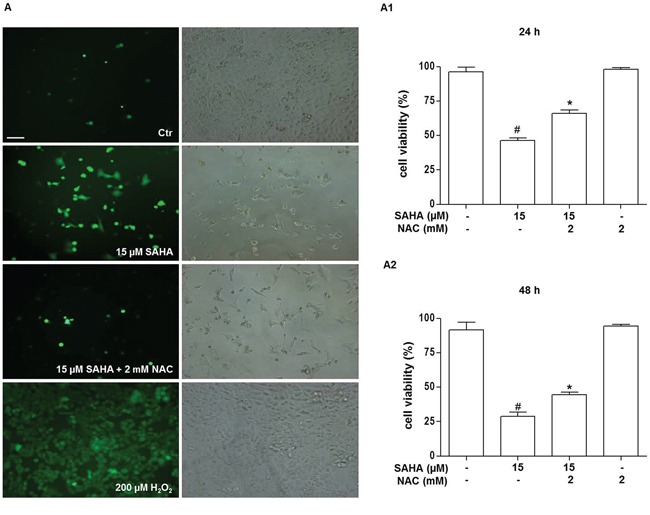
Cells were treated for 24 and 48 h with 15 μM SAHA in the presence or absence of 2 mM NAC. A. Representative photomicrograph of immunofluorescence showing ROS generation in H292 cells stained with H2DCFDA after 48 h of treatment with SAHA. (Bar=40 μm and magnification 200X for all images). A positive control for ROS generation was obtained by treating the cells for 10 min with 200 μM H2O2 (A, bottom right and left images). In (A) the left panels show H2DCFDA-stained cells visualized by FITC filter and the right panels the corresponding images without immunofluorescence. The effect of NAC on SAHA-treated H292 cell viability was evaluated after 24 (A1) and 48 (A2) h of treatment and measured by the MTT assay. In A, A1 and A2 the results are representative of four independent experiments. *p<0.001 vs control, 15 μM SAHA and 2 mM NAC #p<0.001 vs control. Ctr = control.