
Figure 3. SAHA induces mitochondrial depolarization in H292 cells.
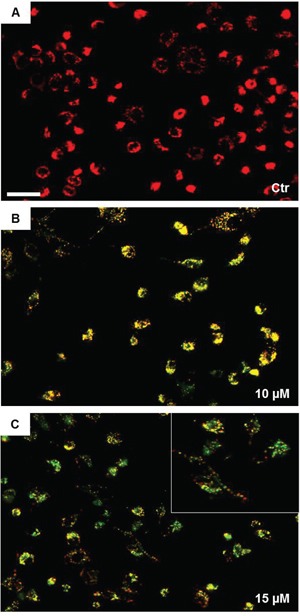
The mitochondrial membrane potential was evaluated by fluorescence microscopy using JC-1 staining. Images were acquired using a Leica DM5000 upright fluorescence microscope (Leica Microsystems) and merges were obtained using NIH Image J 1.40 program after acquisition. The mitochondrial depolarization was observed at 24 h with 10 μM SAHA and increased with 15 μM SAHA. A, B and C panels are representative images from three independent experiments. (Bar=100 μm for all images). The insert in (C) shows the details of depolarized cells. Ctr = control.