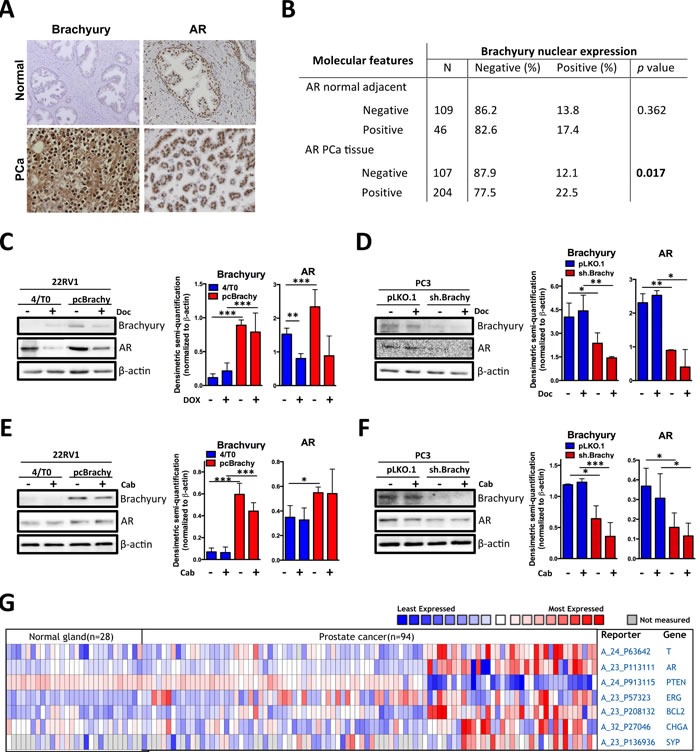
Figure 3. Brachyury is associated with AR, Bcl-2, ERG, CHGA and SYP expression and with loss of PTEN expression.

A. Representative images of Brachyury and AR staining in normal and primary PCa tissues. B. Correlation of Brachyury and AR staining in prostate tissues. Nuclear Brachyury staining is correlated with AR only in primary PCa tissues. C.-F. Western blot analyses for Brachyury and AR expression in prostate cell lines treated with docetaxel (Doc) or with cabazitaxel (Cab). Graphs represent the densimetric semi-quantification of western blot images. G. Heatmap showing the co-expression of Brachyruy (T), AR, PTEN, Bcl-2, ERG, CHGA and SYP in normal and PCa human samples from Oncomine database.
