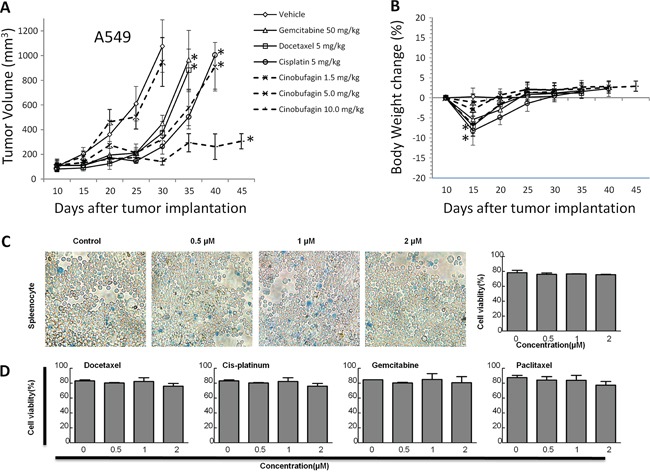
Figure 2. The effects of CB on in vivo tumor growth in human NSCLC cell lines and in vitro cell growth in rat splenocytes.

A. tumor volume and B. body weight over time in response to treatment with CB or platinum drugs in A549 NSG xenograft mouse models (n = 10 mice/each group). Error bars are SD. Down arrows indicate time point from each treatment with vehicle, CB or platinum drugs. All * p < 0.0001 vs. vehicle, Fisher's PLSD test. All experiments were repeated two times. C and D. rat splenocytes were treated for 24 hours with CB and platinum drugs, respectively. Representative images of the splenocytes with different concentrations of CB. Quantitative cell viabilities (%) are presented as mean ± SD of triplicates. All p > 0.05, one-way ANOVA followed by LSD test. All experiments were repeated three times.
