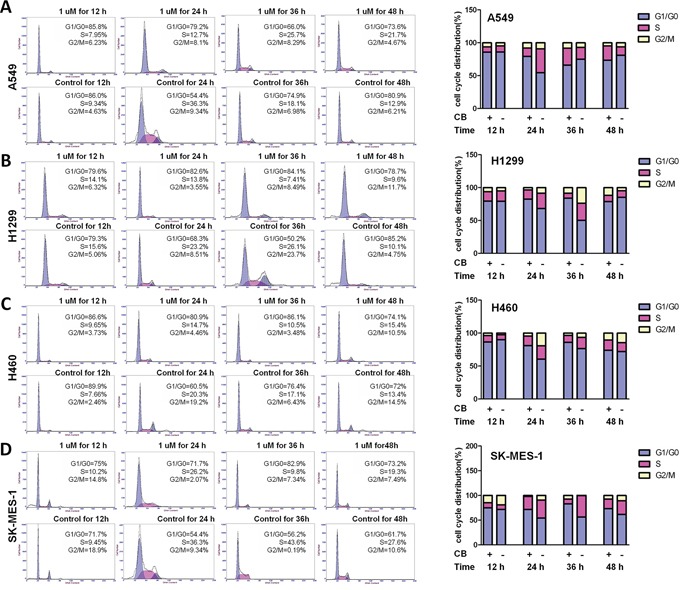
Figure 3. The effects of CB on cell cycle progression in human NSCLC cell lines.

Representative histograms represent the percent of different phases in cell cycle progression. After starvation for 48 hours, cell cycle progression in A459 A. H1299 B. H460 C. and SK-MES-1 D. cells were monitored by PI staining and flow cytometry at 12, 24, 36, and 48 hours after treatment with CB. Quantitative cell cycle progression for G1/G0, S, and G2/M phases are presented as percentage of cells in each cell cycle phase gate. All experiments were repeated three times.
