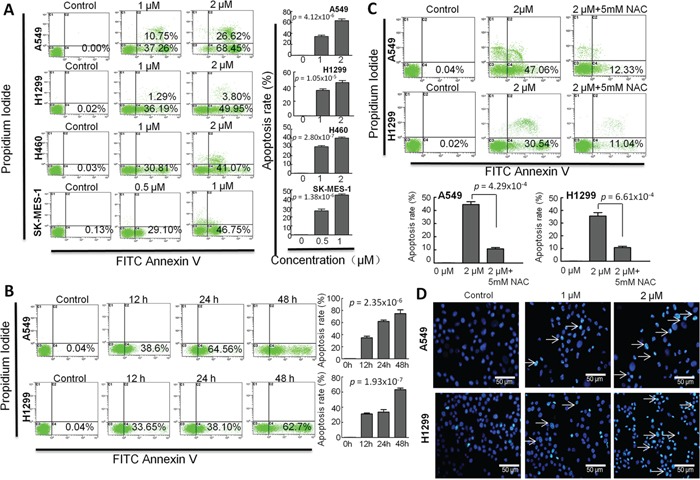
Figure 4. The effects of CB on apoptosis in human NSCLC cell lines.

The cell apoptosis was determined by flow cytometry with Annexin-V/PI staining. Representative histograms represent the percent of apoptotic or necrotic cells. The lower left quadrant (annexin V and PI negative) represents viable cells; The lower right quadrant (annexin V positive and PI negative) represents apoptotic cells in early stage; The upper left quadrant (annexin V negative and PI positive) represents necrotic cells or cellular debris; The upper right quadrant (annexin V and PI positive) represents late apoptotic or necrotic cells. A. A459, H1299 and H460 cells were treated with 0, 1 and 2 μM of CBfor 24 hours;SK-MES-1 cells were treated with 0, 0.5 and 1 μM of CB for 24 hours. B. cells were treated with CB for 0, 12, 24, 48 hours. C. cells were treated with CB at 0, 2 and 2 μM +5mM NAC for 24 hours. D. representative images observed by fluorescence microscopy represent the CB-induced apoptotic cells with Hoechst 33342 staining. White arrows indicate the apoptotic cells with fragmented nuclei. Quantitative apoptosis data are presented as the means and SD of triplicates. A and B p value, one-way ANOVA; C p value, two-tailed Student's t test. All experiments were repeated three times.
