
Figure 4. Effect of brigatinib in a xenograft neuroblastoma model.
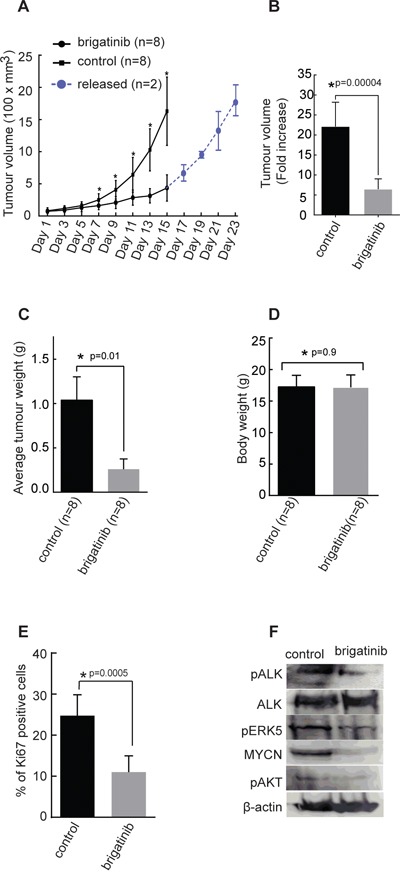
2.5×10⁶ CLB-BAR cells were injected into mice subcutaneously. In the first investigation mice (n=3) were employed and in the second investigation mice (n=5) were employed. A. Tumor growth curves represented as the average volume of either control group or brigatinib group (n=8 for each group, p=0.0002). In the second investigation where 5 mice were employed a subset of mice (n=2) were released from treatment after 14 days, for a further 8 days (blue curve). B. Average tumor volume in control and brigatinib treated groups after 14 days, p=0.00004. C. Average tumor weights in control and brigatinib treated groups after 14 days (p=0.01). D. Average body weight on the day at which mice were sacrificed after 14 days treatment with either brigatinib or vehicle control (p=0.9). E. Immunohistochemical staining of tumors with Ki-67 as a measure of proliferation rate as indicated, Ki-67-positive cells were counted manually per field of vision and quantitative results presented as mean ± SD (p=0.0005). Data are means +/− SE from 8 tumours, p values indicated; Student's t test. F. Immunonblotting analysis of indicated proteins from tumors collected after 8 days of treatment with vehicle or brigatinib.