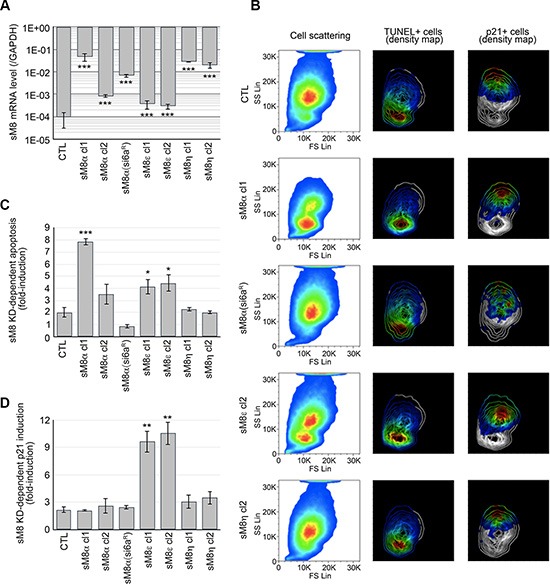
Figure 4. LNCaP C4-2b clones overexpressing a selective sM8 isoform become sensitized to either apoptosis or p21 induction following sM8 knockdown.

(A) LNCaP C4-2b clones stably overexpressing either sM8α or sM8ε or sM8η mRNA at different levels as reported by qPCR. 1 to 2 clones were analyzed per sM8 mRNA. CTL clones were transfected with empty pcDNA4 vector. sM8α(si6aR) mRNA has been mutated in order to resist to siM8(6a)-mediated silencing. (B) Overexpression of sM8 isoforms modifies the size and density of LNCaP cell population as represented in the pseudo-color cell scattering plots (left column). Cells were sorted out by flow cytometry and separated by size (Forward scattering light; FS Lin) and by granularity (Side scattering light: SS Lin). FACS analysis of apoptotic cells (TUNEL positive) and p21-immunolabeled cells is represented by the density pseudo-color plot in middle and right columns, respectively, while scattering of cells by size and granularity is represented by contour plot. Pseudo-color code represents expression levels from the lowest (blue) to highest (red). Each plot represents about 1 million cells. (C) Bar diagram plot shows the sM8 KD-mediated fold-induction of apoptotic cells calculated as the sM8 KD-induced apoptosis rate in sM8 overexpressing clones normalized by the apoptosis rate of wild type LNCaP C4-2. Control (CTL) was figured out as the average of apoptotic rates of two cell clones expressing the empty pcDNA4 vector. (D) Same as C but shows the fold-induction of p21 expressing cells. Experiments were performed three times independently. Values are expressed as Mean ± SD.
