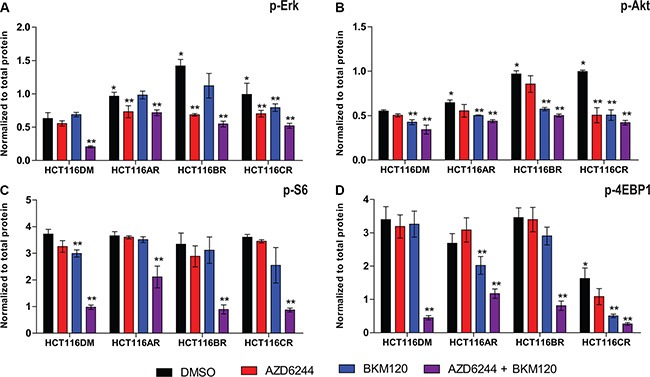
Figure 1. Pathway signaling levels of AQR cell lines.

Phosphorylation levels of (A) Erk, (B) Akt, (C) S6 and (D) 4EBP1 at 24 h post-treatment in HCT116DM, HCT116AR, HCT116BR and HCT116CR cells treated with vehicle (DMSO), AZD6244 alone (IC50 concentration), BKM120 alone (IC50 concentration), and their combination (IC50 + IC50 concentration). Levels were measured by ELISA. All experiments were repeated three times, and data are displayed as mean ± standard deviation of phosphorylated protein normalized to total protein. *indicates p < 0.05 compared to levels in HCT116DM. **indicates p < 0.05 compared to the control levels in the treated cell lines.
