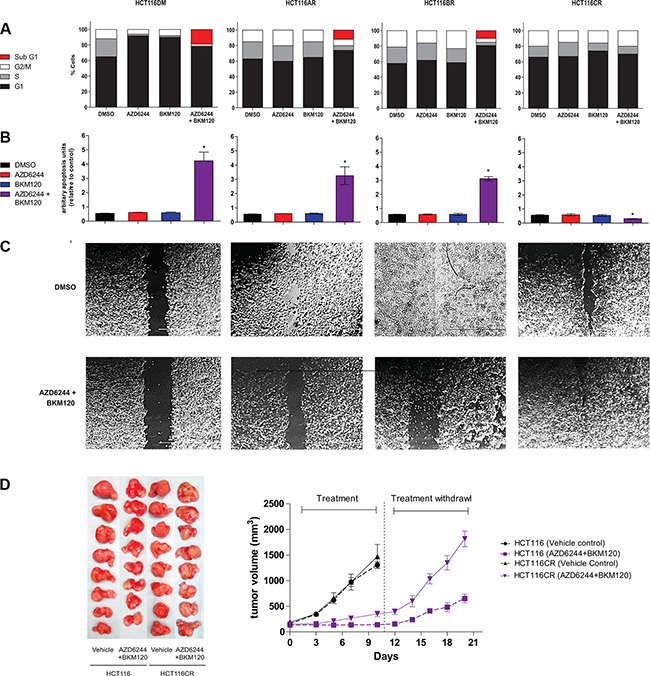
Figure 2. In-vitro and in-vivo phenotypes of AQR cell lines.

(A) Cell cycle phase distribution of cells at baseline and 24 h after exposure to IC50 concentrations of AZD6244 alone, BKM120 alone and AZD6244 and BKM120 combined. (B) Apoptosis of cells at baseline and 24 h after exposure to IC50 concentrations of AZD6244 alone, BKM120 alone and AZD6244 and BKM120 combined. *indicates p < 0.05 compared to cells treated with vehicle (DMSO). (C) Phase contrast images of cells in the wound-healing assay at baseline and 24 h after exposure to IC50 concentrations of AZD6244 alone, BKM120 alone and AZD6244 and BKM120 combined. (D) Images of tumors (left panel) and a chart of tumor volume over time (right panel) of tumors established from HCT116DM or HCT116CR cells in male SCID mice as described in online methods. All experiments were repeated three times, and data are displayed as mean ± standard deviation where relevant.
