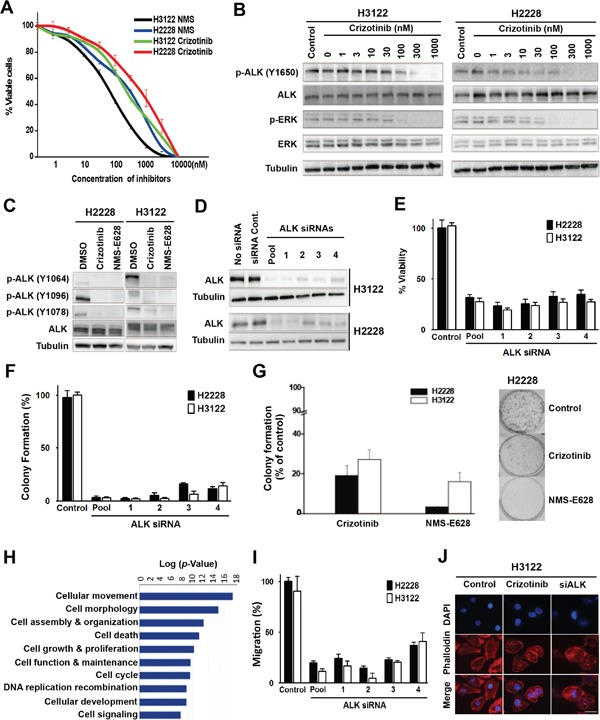
Figure 1. Effects of ALK inhibition in the EML4-ALK-positive NSCLC cells.

A. Cytotoxicity of crizotinib and NMS-E628. H3122 and H2228 cells were grown in 96-well plates and treated with crizotinib or NMS-E628 at the indicated concentrations, and viable cells were measured after 72 hours using an MTS assay. Data are presented as percentage of viable cells in each treatment relative to that in the untreated control cells. B. Western blot analyses of ALK and ERK tyrosine phosphorylation in H2228 and H3122 cells treated with crizotinib. Lysates were extracted from cells treated with the indicated drug concentrations, and subjected to Western blotting. Total tubulin was used as a loading control. C. Validation of mass spectrometry data of ALK phosphorylation at multiple tyrosine residues. Lysates from H2228 and H3122 cells treated with crizotinib (900nM) or NMS-E628 (300nM) for 1 hr were subjected to Western blotting, probed with three anti-p-ALK antibodies. D. Western blot confirmation of ALK knockdown by siRNAs. H3122 and H2228 cells treated with ALK siRNA smartpool of four siRNAs and four individual siRNAs at 20 nM for 72 h. E. MTS assay measuring the effect of ALK siRNA knockdown (20 nM for 72 h in triplicate) on the viability of H3122 and H2228 cells (Student's t-test: p-value < 0.05). F. Effect of ALK siRNA knockdown on cell viability measured by colony formation assay. The numbers of foci for each treatment, visualized with Giemsa stain, are the average of duplicate plates from three independent experiments, and are presented as a percentage relative to the number of foci formed in the control plates (Student's t-test: p-value < 0.05). G. Effects of crizotinib (900nM) or NMS-E628 (300nM) on colony formation of H3122 and H2228 cells (Student's t-test: p-value < 0.05). Right panel shows representative foci of H2228 cells treated with/without crizotinib or NMS-E628. H. Ingenuity Pathway Analysis (IPA) of cellular functions reveals high enrichment of proteins involved in cell migration and cytoskeleton modification. The proteins identified by LC-MS/MS with at least 2-fold decrease of phosphorylation after ALK inhibitor treatment were analyzed for association with different cellular functions and with any of 80 canonical pathways and sorted according to their statistical significance of association. The graph represents the analysis of proteins in the crizotinib treated H2228 cells. I. Effect of ALK siRNA knockdown on the migration of H3122 and H2228 cell lines treated with ALK siRNA, assessed using quantitative Boyden Chamber technique. J. Visualization of F-actin by immunofluorescence staining using anti-phalloidin antibody in H3122 cells treated with/without crizotinib (900nM) or smartpool siALK. Cell images are shown with DAPI in (blue) and phalloidin in (red). Scale bar: 10 μm.
