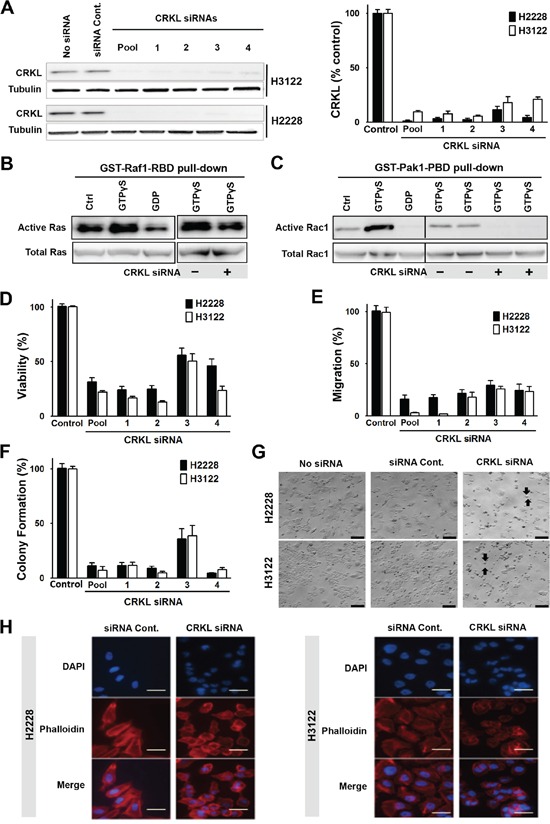
Figure 3. CRKL mediates ALK signaling and regulates cytoskeleton, cell migration and survival.

A. CRKL siRNA knockdown in H2228 and H3122. Protein lysates were extracted from cells treated with four individual CRLK siRNAs (20 nM) or their smartpool for 72 h, and subjected to Western blot analyses. The graph shows the quantification of CRKL proteins. B. Inhibition of Ras GTPase activity by CRKL siRNA knockdown. Upper left panel: Lysates of untreated H3122 cells were incubated with buffer (Ctrl), non-hydrolyzable analog of GTP (GTPγS as a positive control) or GDP (as a negative control). Upper right panel: Lysates of H3122 cells treated with or without CRKL siRNA were incubated with GTPγS. Active GTP-bound Ras was pulled down by GST-fusion Ras-binding domain of Raf1 (GST-Raf1-RBD) and detected by immunoblotting with Ras antibody. Lower panels: Total Ras is shown as the input control. C. Inhibition of Rac1 GTPase by CRKL siRNA knockdown. Upper left panel: H3122 cell lysates were incubated with buffer (Ctrl), or as positive and negative controls, with GTPγS and GDP, respectively. Upper right panel: H3122 cell lysates with or without CRKL siRNA knockdown were incubated with GTPγS. Active GTP-bound Rac1 was pulled down by GST-fusion p21 binding domain of p21-activated kinase 1 (Pak1) (GST-Pak1-PBD) and detected by immunoblotting with Rac1 antibody. Lower panels: Total Rac1 serves as the input control. D. Cell viability assessed 72h after treatment with or without CRKL siRNAs by MTS assay, E. Cell migration, assessed using quantitative Boyden Chamber technique (16h after plating), and F. Colony formation assays (10 days after plating) were also performed in H3122 and H2228 cells with/without CRKL siRNA knockdown. Data represent the means of at least three independent experiments and are presented as percentage of untreated cells (Student's t-test: p-value < 0.05). G. Bright field images of H2228 and H3122 cells treated with/without CRKL siRNA smartpool or control siRNA. Arrows: round-up cells; Scale bar: 20 μm. H. Visualization of F-actin in H2228 (left panel) and H3122 (right panel) treated with either control siRNA or CRKL siRNA smartpool by immunofluorescence staining with phalloidin antibody (red). Blue color indicates DAPI staining. Scale bar: 10 μm.
