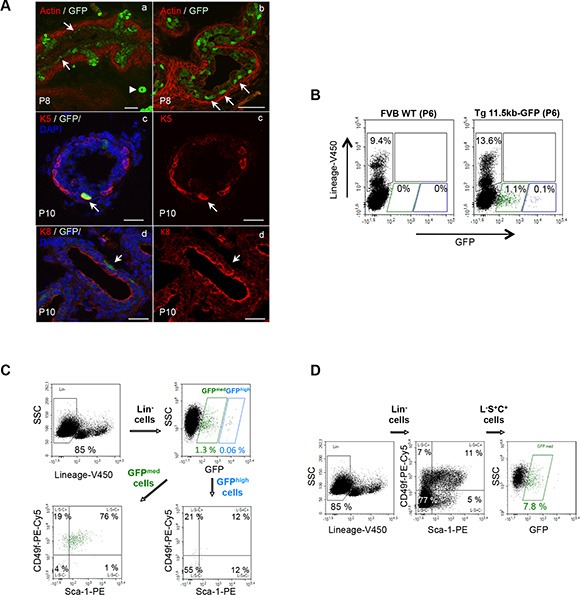
Figure 2. s-SHIP/GFP-expressing cells are a subset of neonatal basal prostate cells.

(A) s-SHIP/GFP-expressing cells localized into the basal region of the prostate epithelium in the differentiating ducts of Tg11.5kb-GFP mice; representative photographs (n > 10) of frozen sections of P8 prostate tissues from Tg 11.5kb-GFP mice stained with phalloidin-Alexa594 for polymerized actin (red) to show the glandular architecture (a,b); arrows indicate GFP+ cells located in close contact with the basement membrane and the arrowhead indicates a blood vessel. Representative photographs (n > 5) of immunofluorescent staining (red) of P10 frozen prostate sections for basal cell marker cytokeratin 5 (K5) (c) and luminal cell marker cytokeratin 8 (K8) (d); arrows mark K5+ GFP+ (c) or K8− GFP+ (d) cells. Sections were counterstained with DAPI nuclear stain (blue) (c,d). (B) Both GFP-expressing cell populations were negative for lineage cell surface markers; representative flow cytometry analysis (n = 3) of dissociated prostate cells isolated from P6 wild-type FVB (left panel) and P6 Tg 11.5kb-GFP (right panel) mice and stained with V450-conjugated antibodies against non-prostate cell lineage markers (CD31, CD45, and TER119). (C, D) s-SHIP/GFPmed expression identifies a subpopulation of L-S+C+ prostate basal cells. Representative flow cytometry analysis (n > 10) of dissociated prostate cells isolated from P6 Tg 11.5kb-GFP mice and stained with V450-conjugated antibodies against non-prostate cell lineage markers (Lin), with PE-conjugated antibodies anti-Sca-1 and PE-Cy5-conjugated antibodies anti-CD49f. FACS plots show gates drawn for sequential analysis of (C) Sca-1 and CD49f cell surface marker expression on Lin− GFPhigh and Lin− GFPmed cell subpopulations, and (D) GFP expression on Lin− Sca-1+ CD49f+ (L-S+C+) cell subpopulation. Side scatter (SSC), phycoerythrin (PE), phycoerythrin-cyanine 5 (PE-Cy5). Scale bars: 50 μm (Aa–b), 20 μm (Ac–d).
