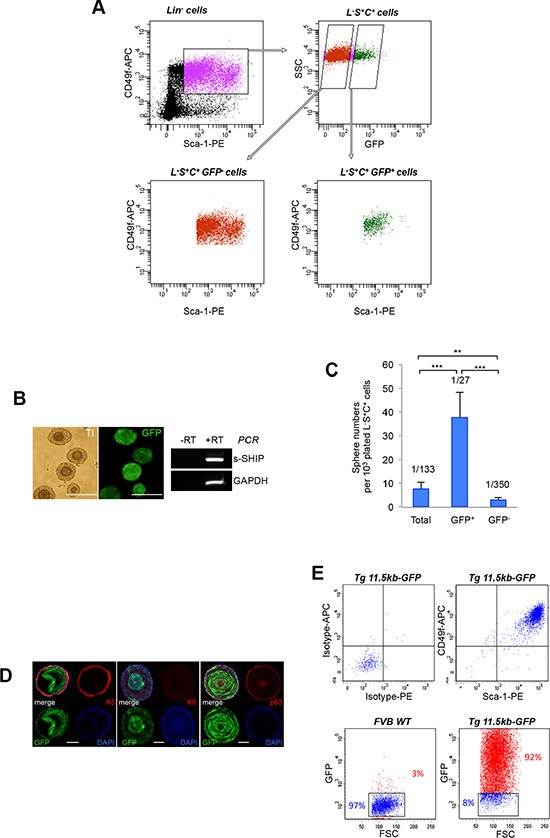
Figure 3. The s-SHIP/GFP-expressing subpopulation is enriched for sphere–forming cells.

(A) Dissociated prostate cells isolated from P6 Tg 11.5kb-GFP mice were stained with V450-conjugated antibodies against non-prostate cell lineage markers (Lin), PE-conjugated antibodies anti-Sca-1 and APC-conjugated antibodies anti-CD49f. Representative FACS plots (n > 10) show gates drawn for sequential cell sorting of total Lin− Sca-1+ CD49f+ (L-S+C+) cells, then L-S+C+ GFP− cells or L-S+C+ GFP+ cells. (B) Representative images (n = 3) of double–layered prostate spheres derived from LSC GFP+ cells (left panels); representative RT-PCR analysis (n = 2) of s-SHIP transcript expression in sphere cells (right panel). (C) Bar graph shows the percentage of sphere-forming cells in total, GFP+ or GFP− LSC cell populations that were sorted from prostate single-cell suspension isolated from P6 Tg 11.5kb-GFP mice, plated in Matrigel culture and grown for 10 days. Data represent the mean ± s.d. of three independent experiments, p values was determined by Student's test ***p < 0.001, **p < 0.01. (D) Immunostaining for basal cell marker cytokeratin 5 (K5) (left panel), luminal cell marker cytokeratin 8 (K8) (middle panel), basal cell marker p63 (right panel) on frozen sections of spheres derived from GFP+ LSC cells. (E) Sphere cells have a homogenous L-S+C+ GFP+ phenotype. Representative flow cytometry analysis (n = 3) of CD49f and Sca-1 cell surface markers (upper panels) and GFP (lower panels) expression on dissociated prostate sphere cells. Transillumination (TI), reverse transcription-polymerase chain reaction (RT-PCR), side scatter (SSC), phycoerythrin (PE), allophycocyanin (APC). Scale bars: 250 μm (B), 50 μm (D).
