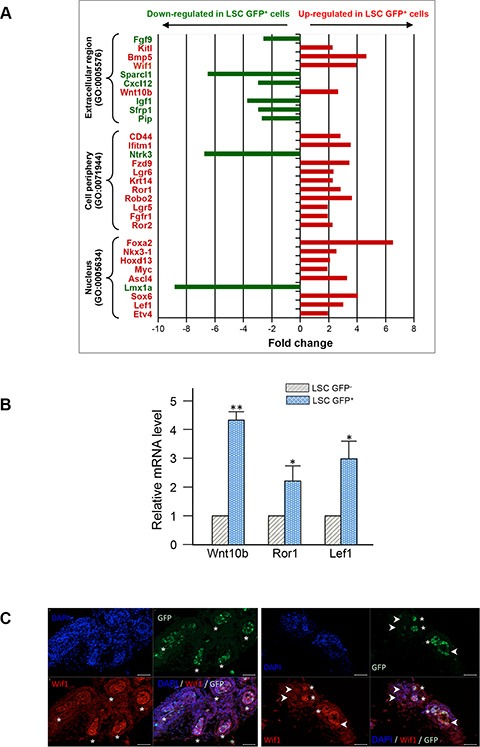
Figure 6. Profiling of gene expression in LSC GFP+ versus LSC GFP− basal cells.

(A) Total RNA was isolated from three independent samples of sorted LSC GFP+ and LSC GFP− cells and linear RNA amplification was performed to obtain sufficient amount of high-quality RNA for analysis by SurePrint G3 Mouse GE 8 × 60K microarray (Agilent). Thirty genes were selected from the master list of genes differentially regulated (at least 1.9 fold with a p value < 0.05) and grouped into three different Gene Ontology (GO) terms. Up-regulated or down-regulated genes in LSC GFP+ cells as compared to LSC GFP− cells are presented in red and green, respectively. (B) Real –time quantitative RT-qPCR confirmation of 3 candidate genes between LSC GFP− and LSC GFP+ cells. Relative gene expressions were normalized by comparison with the expression of GAPDH and analysed using the 2− ΔΔ CT method. The expression values were adjusted by setting the expression of LSC GFP− to be 1 for each gene. Data represent means with s.d. from three independent experiments, p values was determined by Student's test **p < 0.01, *p < 0.05. (C) Representative photographs of immunofluorescent staining (red) of P6 frozen prostate sections for WIF1; white asterisks show GFP+ cells expressing Wif1 and white arrows-heads mark GFP− cells expressing a lower level of Wif1. Sections were counterstained with DAPI nuclear stain (blue). Scale bars: 50 μm (C).
