
Figure 3. PR analysis of 1H-NMR fecal spectra between different stages of CRC and healthy control.
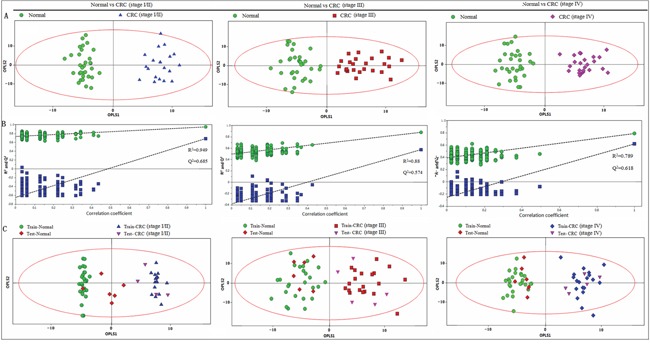
A. OPLS-DA scatter plot based on healthy controls and each stage of CRC, green dots represent healthy control (n = 32); blue triangles represent stage I/II (n = 20); red boxes represent stage III (n = 25) and purple diamonds represent stage IV (n = 23). B. statistical validation of the corresponding PLS-DA model by permutation analysis (200 times). C. scores plot of OPLS-DA prediction model. 80% of samples were applied to construct the model, and then used it to predict the remaining 20% of samples (“testing set”, healthy controls = 6; stage I/II = 4; stage III = 5; stage IV = 5). Red diamonds represent healthy controls and purple inverted triangles represent CRC.