
Figure 4. Metabolic network of the significantly changed metabolites involved in glycolysis, TCA cycle and amino acid metabolism.
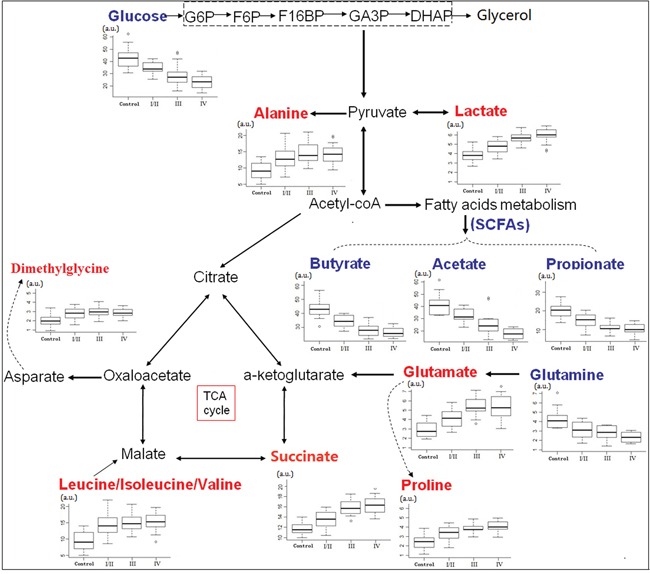
Box-and-whisker plots of metabolites that showed progressive changes over different CRC stages relative to healthy controls. Horizontal line in the middle portion of the box, median; bottom and top boundaries of boxes, lower and upper quartile; whiskers, 5th and 95th percentiles; open circles, outliers. Red text = increased with respect to control, blue text = decreased.