
Figure 1. Expression of B7-H3 on different human tumor cells.
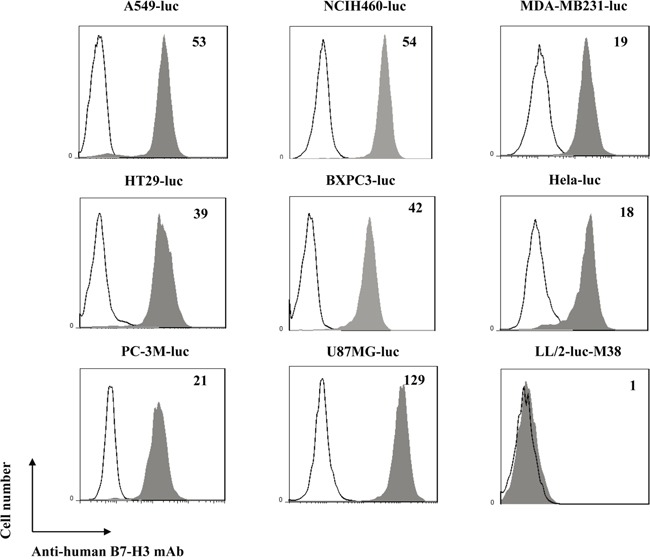
Shaded histogram represents cells stained with anti-B7-H3 mAb and un-shaded histogram represents cells stained with the control mouse IgG1. Mean Fluorescent Intensity (MFI) values obtained with anti-B7-H3 mAb staining divided by the control isotype staining are indicated in the upper right of the histogram.