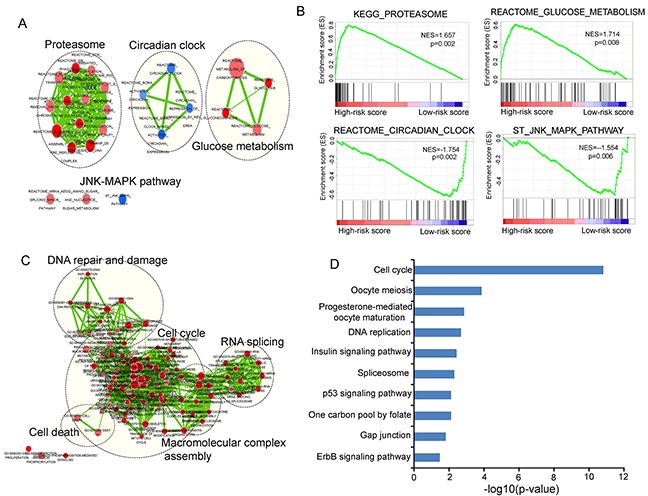
Figure 8. Functional analysis of the prognostic lncRNAs.

A. The enrichment map of gene sets with each node represents a gene set and an edge represents the proportion of shared genes between connecting gene sets. B. The enriched biological pathways and processes associated with risk score. C. The functional enrichment map of GO terms with each node represents a GO term and an edge represents the proportion of shared genes between connecting GO terms. D. The enriched KEGG pathways ranked by −log10 (p-value).
