Fig. 3.

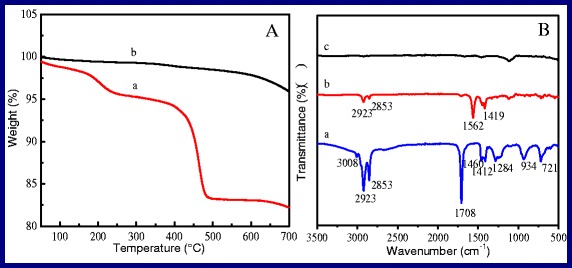
a The TGA curves of NaYF4:Yb,Er NPs. a OA-capped samples, b OA-free samples. b FTIR absorption spectra of as-prepared NaYF4:Yb, Er NPs before and after removing OA layer. a OA, b OA-capped samples, c OA-free samples

a The TGA curves of NaYF4:Yb,Er NPs. a OA-capped samples, b OA-free samples. b FTIR absorption spectra of as-prepared NaYF4:Yb, Er NPs before and after removing OA layer. a OA, b OA-capped samples, c OA-free samples