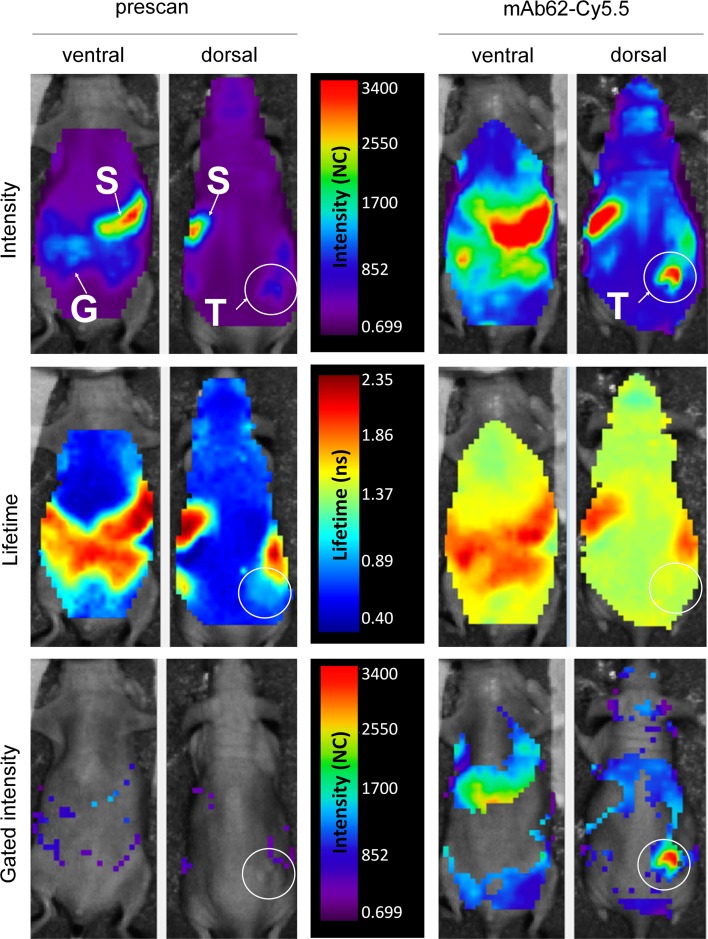
Fig. 3.
In vivo characterisation of mAb62-Cy5.5-derived fluorescence. Representative intensity and lifetime maps of an MDA-MB-435S tumour-bearing mouse are shown before (left; prescan) and 24 h after i.v. injection of mAb62-Cy5.5, scanned ventrally and dorsally in vivo with the Optix MX2. Upper panel shows fluorescence intensity scans with a low background autofluorescence and signals detected over the stomach (S) and gastrointestinal tract (G). Strong fluorescence over the Kv10.1-expressing tumour (T) as well as an increase in the overall background was measured 24 h after application of mAb62-Cy5.5. Lifetime (middle panel) of the background fluorescence was 0.6–0.8 ns in the prescans and increased to 1.4–1.6 ns after application of the probe, whereas the fluorescence lifetime over the gastrointestinal tract remained the same (1.9–2.3 ns). The lower panel shows fluorescence intensity maps after setting the lifetime gate to 1.50–1.65 ns. Note that not only the high fluorescence intensity over the tumour area but also some of the fluorescence over the whole body remained after gating. Fluorescence is shown in normalised counts (NC)

