Fig. 4.
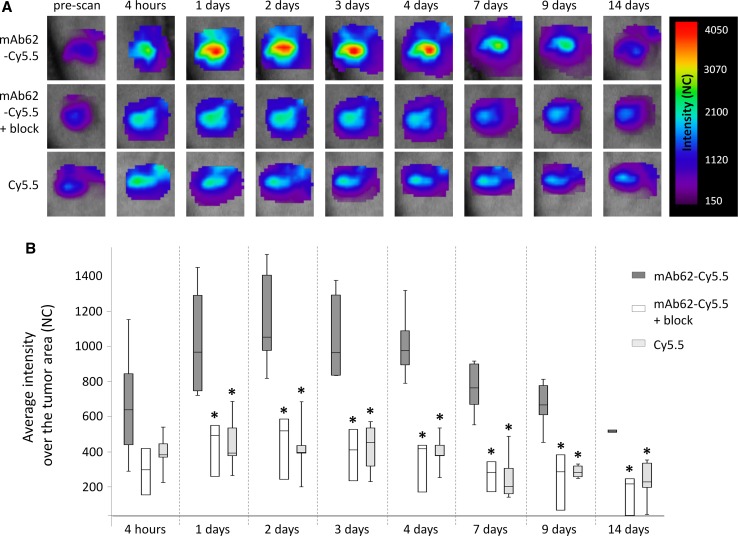
In vivo time-domain fluorescence imaging of subcutaneous Kv10.1-expressing MDA-MB-435S tumours in mice injected with mAb62-Cy5.5 a Representative series of scans over the tumour areas acquired at different time points after injection of 25 µg of mAb62-Cy5.5 (n = 8 for 1 day, 2 days and 7 days; n = 6 for 4 h, 3 days and 4 days; n = 5 for 9 days and n = 3 for 14 days), of 25 µg of mAb62-Cy5.5 together with unlabelled mAb62 (n = 3) and of 1.2 µg of Cy5.5 (n = 5) are shown. b Box plot showing significantly higher average fluorescence intensities (NC) measured over time over the MDA-MB-435S tumours of mice injected with 25 µg mAb62-Cy5.5 compared to the tumours of mice injected with 25 µg of the mAb62-Cy5.5 together with twofold excess (50 µg) of mAb62 (blocking experiment) or with 1.2 µg of free Cy5.5 fluorophore (*p < 0.05)

