
Fig. 5.
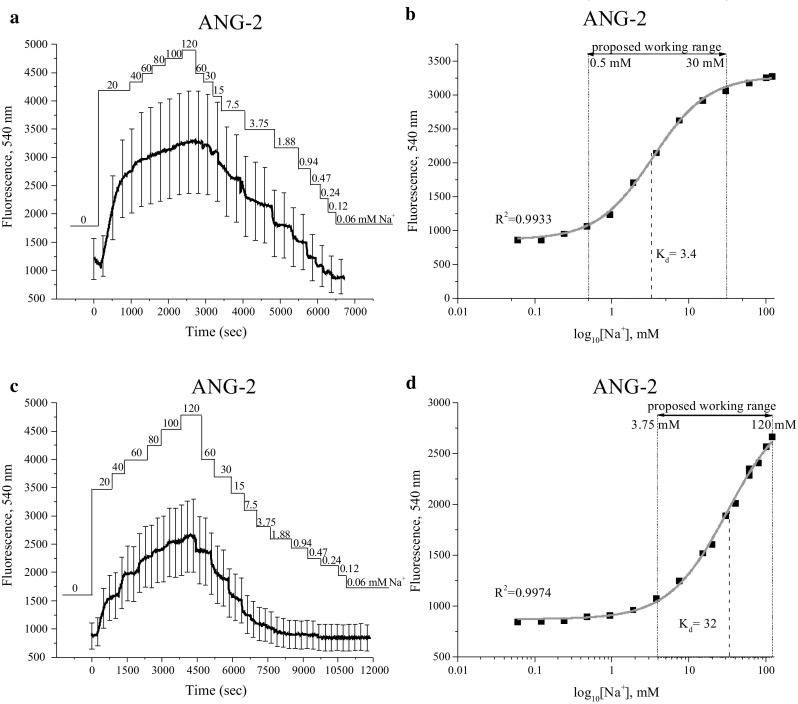
Calibration of ANG-2 in human prostate cancer PC-3 cells. The real-time [Na+]o (0–120 mM) are indicated. Calibrations performed with choline solution are represented in a, b, whereas with K+ solution in c, d. a, c Emitted fluorescence intensities at 540 nm. In b and e the data shown is derived from a and c that have been plotted versus log10 of the known Na+ concentrations and fitted using a logistic function. Data are represented as mean ± SD