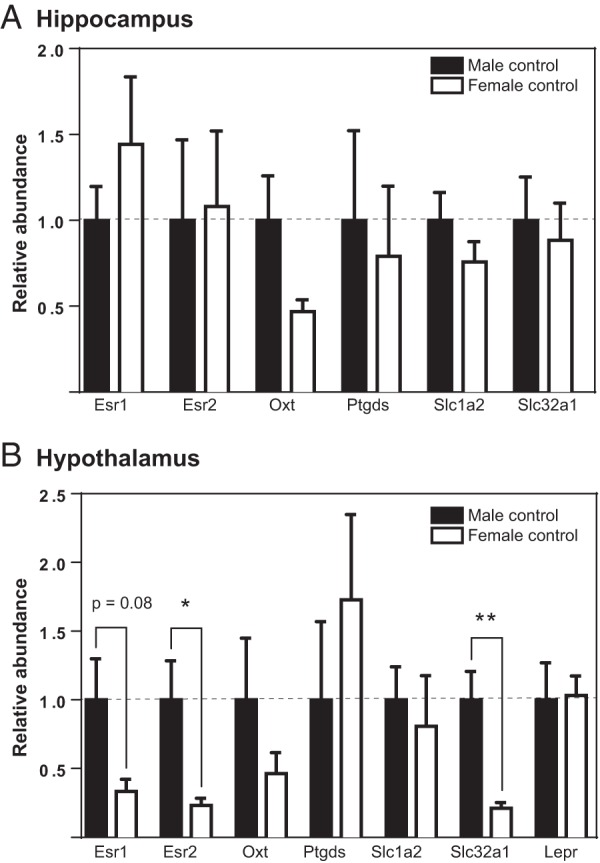
Figure 6.

Sex differences in hippocampal and hypothalamic expression of selected genes. Relative differences in gene expression between male and female control (unexposed) groups with male gene expression set as baseline. A, No genes were sexually dimorphic in the neonatal hippocampus. B, Esr2 and Slc32a1 exhibited male biased expression. Graphs depict mean ± SEM; *, P ≤ .05 and **, P ≤ .01.
