Figure 1.
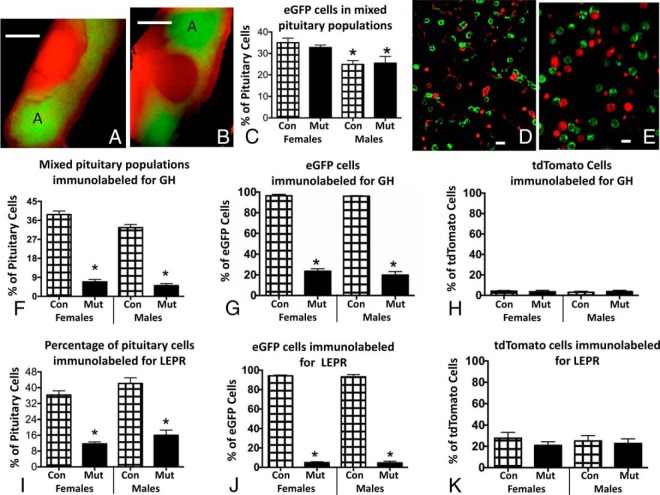
A and B, Whole female pituitaries from a control (A) and somatotrope Lepr-null mutant (B) showing expected concentration of eGFP cells (green fluorescence) in anterior pituitary lateral lobes (region A). The remaining cells are tdTomato positive. Note there are no eGFP cells in the neurointermediate lobe. Also, there is no loss of signal for eGFP in the pituitary from the mutant. Bar, 500 μm. C, Counts of eGFP-labeled cells in dispersed mixed anterior pituitary cells show no differences when controls and somatotrope Lepr-null mutants are compared. However, females have more eGFP cells than males. *, Lowest values (ANOVA, P = .04; n = 9 averages or 2000 cells/group). D and E, Images of dispersed pituitary cells from female control (D) or somatotrope Lepr-null mutant (E) show no differences between these groups in numbers of eGFP cells. Note fluorescence is concentrated at periphery of the cells. Bar, 10 μm. F, Counts of the overall percentages of immunopositive GH cells in mixed pituitary populations from control or mutant male or female mice show significant reductions in GH cells in mutants. *, Lowest values (ANOVA, P < .0001; Tukey's post hoc test; n = 9 averages or 1500–2000 cells/group). G, Analyses of the percentages of eGFP cells that are immunolabeled for GH in control or mutant pituitary cells show that 99% of eGFP cells are immunolabeled in controls but not mutant populations. *, Lowest values (ANOVA, P < .0001; Newman-Keul's; n = 9 averages or 1500–2000 cells/group). H, Counts of tdTomato cells with immunolabeling for GH show 3%–4% store GH and there are no differences seen among any of the experimental groups (ANOVA/Tukey's, P = .9; n = 9 averages or 1500–2000 cells/group). I, Counts of mixed pituitary cells immunolabeled for LEPR show significant reductions in the somatotrope Lepr-null mutants. *, Lowest values, ANOVA/Tukey's;. P < .0001; n = 3–9 averages or 1200–1500 cells/group). J and K, Analysis of percentages of eGFP cells immunolabeled for LEPR show a dramatic reduction in LEPR proteins in eGFP cells (J) but not in tdTomato cells (K). *, Lowest values (ANOVA/Tukey's, P < .0001; n = 3–9 averages or 1200–1500 cells/group). Con, control; Mut, mutant.

