Figure 5.
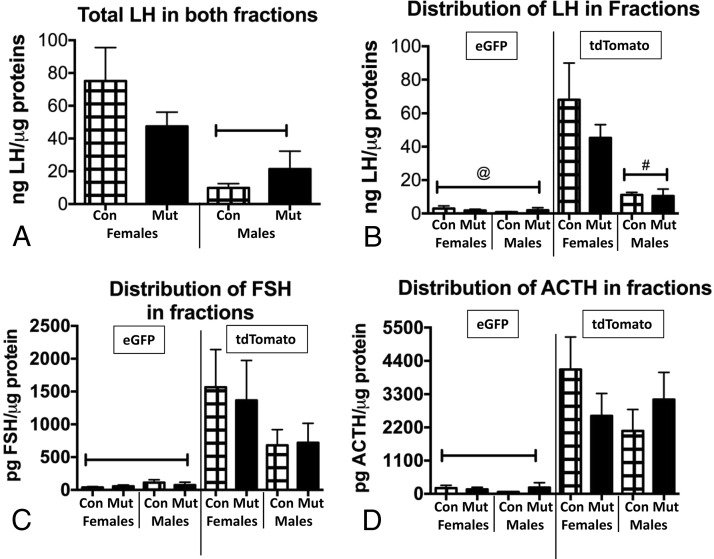
A, Multiplex EIAs of LH show sex differences in total LH in both fractions, with females having higher LH levels. Capped bar, lowest values (ANOVA/Newman-Keuls, P = .01; n = 4–5). B, Distribution of LH across eGFP and tdTomato fractions of controls (Con) and somatotrope Lepr-null mutants (Mut) showing no difference in fractions from mutants. LH is barely detectable in eGFP fractions, and the sex difference is seen in the tdTomato fractions. @, Values significantly lower than all others; #, values lower than control and mutant females (ANOVA/Newman-Keuls, P < .0001; n = 4–5). C, Distribution of FSH in eGFP vs tdTomato fractions shows no sex differences or differences between controls (Con) and mutants (Mut). FSH is barely detectable in eGFP fractions. Capped bar, Lowest values by ANOVA/Newman-Keuls (P = .0059; n = 4–5). D, ACTH distribution is similar to that of FSH with no sex differences or differences between controls and mutants. It is also barely detectable in the eGFP fractions. Capped bar, Lowest values by ANOVA/Newman-Keuls (P = .0002; n = 4–5).

