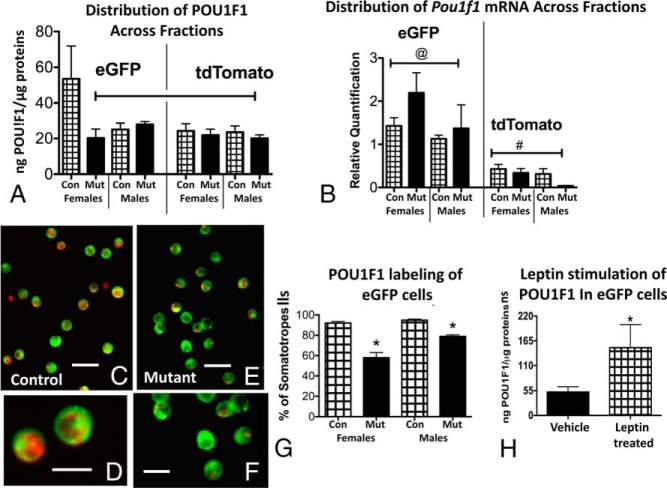
Figure 8.
A, POU1F1 EIAs were applied to protein fractions from all experimental groups. The highest values were seen in eGFP fractions from control (Con) females. eGFP fractions from somatotrope Lepr-null females showed reduced POU1F1 levels. eGFP fractions from control and mutant (Mut) males were not different from one another. Similarly, POU1F1 levels in tdTomato fractions were not different when controls and mutants or males and females were compared. Capped line, Lowest values, not different from one another but different from control female eGFP levels (ANOVA/Newman-Keuls, P = .02; n = 4–5). B, Distribution of Pou1f1 mRNA in all experimental groups showing highest levels in all eGFP fractions. There are no differences between males and females, nor are there sex differences. @, Highest values, not different from one another; #, lowest values (ANOVA/Newman-Keuls, P < .0001; n = 4–5). C and D, Immunolabeling for POU1F1 in control eGFP cells showing red fluorescent labeling in nearly 100% of the cells. E and F, eGFP cells from somatotrope Lepr-null mutants showing reduced red fluorescent POU1F1 labeling. Bar, 30 μm (panels C and E); bar, 15 μm (panels D and F). G, Counts of eGFP cells labeled with POU1F1 (1500 cells) show a significant 40% reduction in eGFP cells from females and 16% in eGFP cells from males. *, Lowest values (ANOVA/Newman-Keuls test, P < .01; n = 9). H, eGFP cells from females were stimulated for 3 hours with leptin (10 nM) and extracts assayed for POU1F1. EIAs showed a 3-fold increase in POU1F1 expression in eGFP cells. *, Significantly different from vehicle control (P = .037; n = 4–5; Student's t test).

