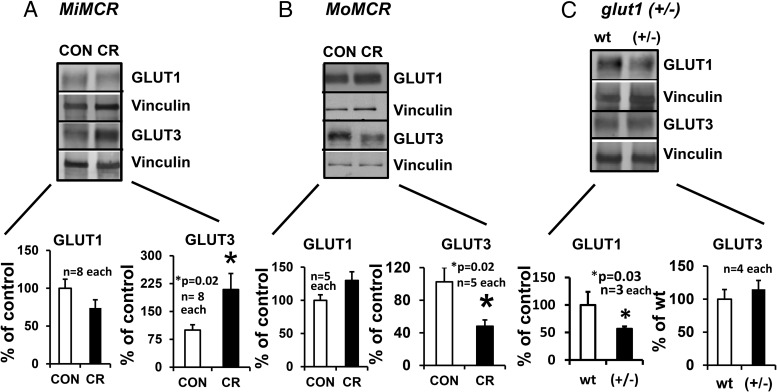
Figure 3.
Placental GLUT1 and GLUT3 proteins were quantified by Western blot analysis at GD19 in MiMCR vs CON (A), MoMCR vs CON (B), and glut1 (+/−) vs wt (+/+) (C). Upper panels demonstrate representative Western blots depicting the 45-kDa GLUT1 and 50-kDa GLUT3 protein bands with their corresponding vinculin protein bands, which served as the internal control in CON and CR GD19 placentas. Lower panels demonstrate the densitometric quantification of GLUT1 and GLUT3/vinculin protein depicted as a percentage of CON/wt values. *, P = .02 vs CON/wt. CR, respective maternal calorie restriction.

