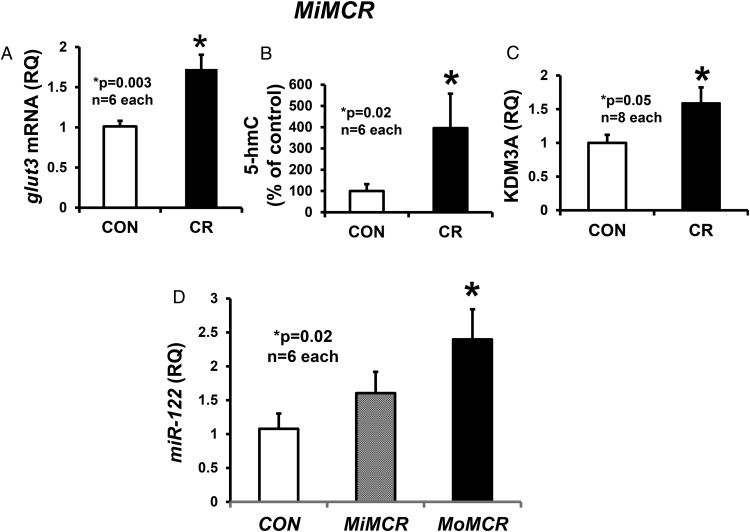
Figure 6.
Placental glut3 mRNA, 5-hydroxymethylation, and glut3-KDM3A quantification. GLUT3 mRNA quantified by reverse transcription and real-time qPCR (A), DNA 5-hmC by antibody capture and detection assay (B), recruitment of KDM3A to the glut3 gene locus by ChIP assay and PCR (C), and RT-qPCR of miR-122 (D) are shown in CON and CR GD19 MiMCR and MoMCR (only miR-122) placentas. P values are shown in the graphs. CR, respective maternal calorie restriction.

