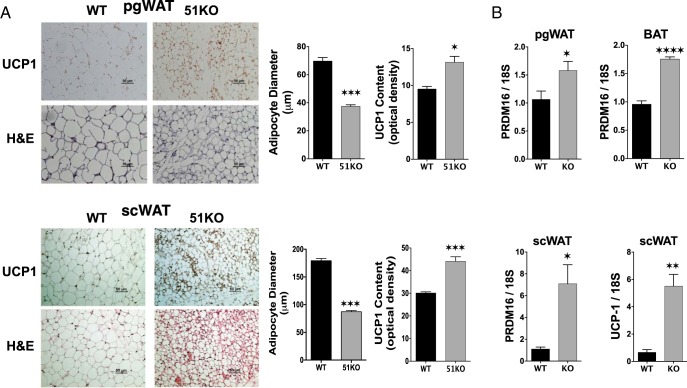
Figure 7.
Evidence for browning of WAT in FKBP51-KO mice A, Perigonadal (pgWAT) and sc (scWAT) adipose tissues from WT and KO mice fed RD were subjected to indirect immunohistochemical and H&E staining to assess UCP-1 content and adipocyte diameters, respectively. B, Real-time PCR analysis of PRDM16 and UCP-1 in pgWAT, scWAT and BAT adipose tissues from WT and KO mice fed a RD (n = 4–5). Data shown are mean ± SEM; #, RD vs HF; *, WT vs KO. All genes were normalized to 18S RNA.

