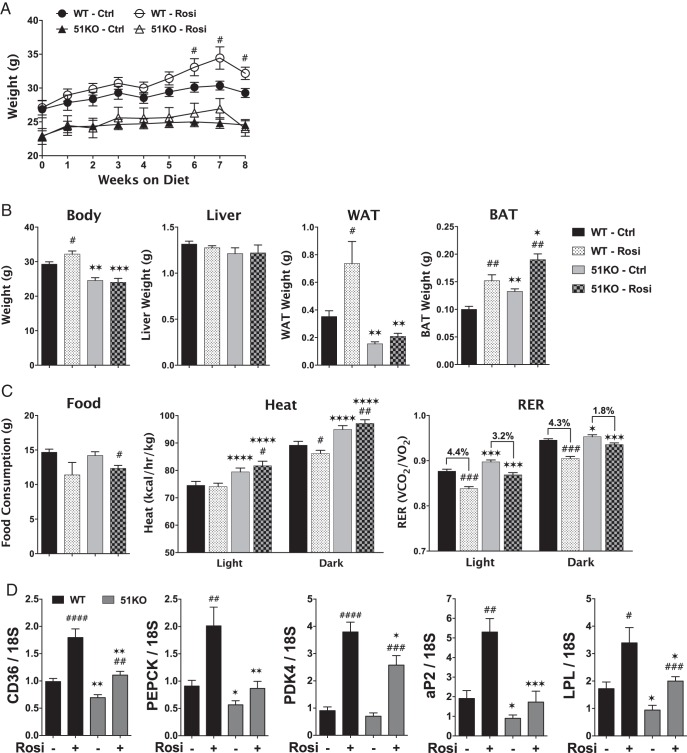
Figure 8.
FKBP51-KO mice are resistant to the PPARγ agonist rosiglitazone. A, Growth curves for 3- to 4-month-old WT and KO mice placed on control and rosiglitazone-containing diets for 8 weeks (n = 5). B, Organ and tissue weights of control and rosiglitazone-fed WT and KO mice on the eighth week of diet (n = 5). C, Indirect calorimetry of control and rosiglitazone-fed WT and KO mice on the eighth week of diet (n = 5). D, Real-time PCR analysis of the indicated genes in perigonadal WAT of control and rosiglitazone-fed WT and KO mice (n = 5). Data shown are mean ± SEM; #, Ctrl vs Rosi at same genotype; *, WT vs KO at same treatment.

