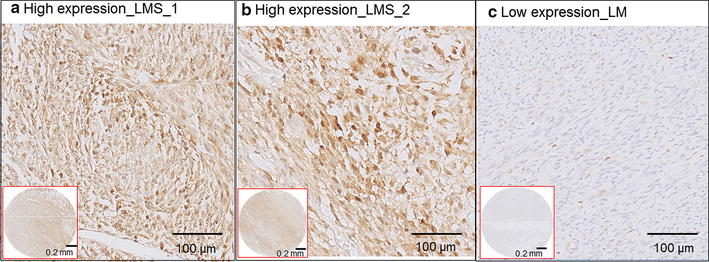
Fig. 2.

Representative images of immunohistochemistry of PSME1. a and b are two leiomyosarcoma (LMS) samples with high expression of PSME1. c A uterine leiomyoma (LM) control sample with low expression of PSME1. Images in red squares are the overviews of expression the tissue microarray cores for respective samples
