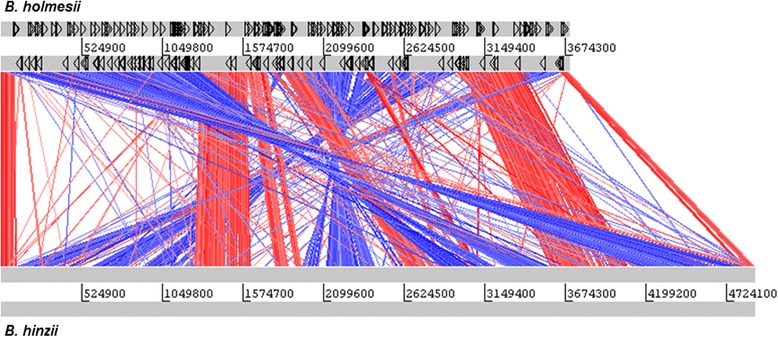
Fig. 4.

Genome comparison of B. holmesii and B. hinzii. Protein similarity (TBLASTX) between the genomes as red lines (direct matches) and blue lines (inverted matches). The gray bars represent the forward and reverse DNA strands, black triangles denote IS elements (ISEs). Many chromosomal break points are flanked by ISEs suggesting genome reduction via ISEs
