
Fig. 4.
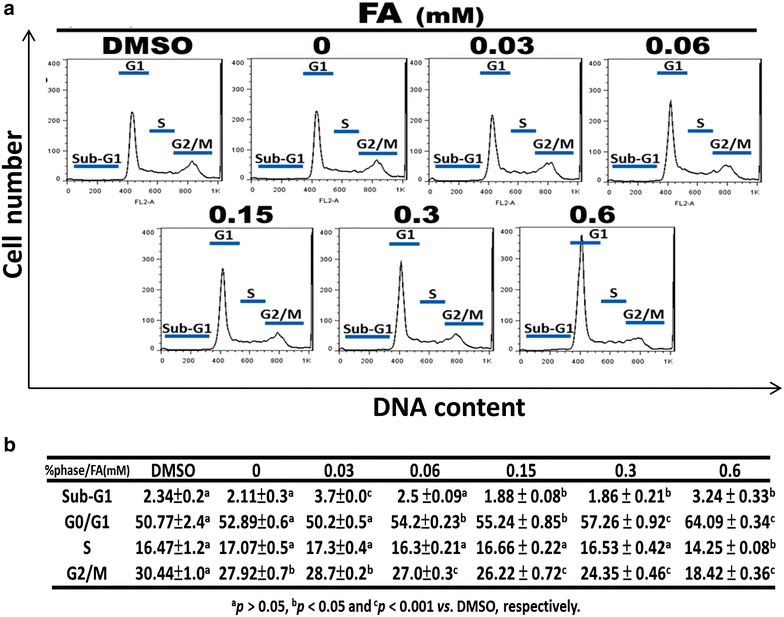
Effect of trans-FA on cell-cycle progression of H1299 cells. H1299 cells were treated with the indicated doses, 0.03, 0.06, 0.15, 0.3 and 0.6 mM of trans-FA for 48 h respectively. a An accumulation of G0/G1 population in trans-FA-treated H1299 cells and vehicle controls at 48 h. b The quantification analysis. Data are presented as mean ± SD (n = 3). Different letter notations indicate the statistical significance between control and trans-FA treatment groups (a no significance; a vs b and a vs c, statistically significant with P < 0.05 and 0.001, respectively)