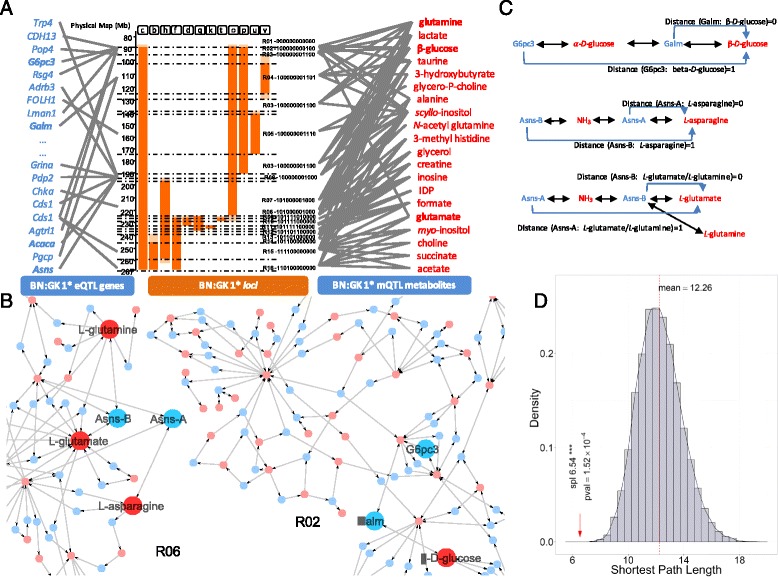
Fig. 4.

Network topological analysis of genetically regulated transcripts and metabotypes. a Summary of adipose transcripts and metabotypes associated with genomic regions using joint eQTL and mQTL mapping. b Mapping of mQTL-responsive metabolites and eQTL-responsive genes on an adipose-specific metabolic network. c Biologically relevant relationships between mQTL-responsive metabolites and eQTL-responsive transcripts highlighted by ranking of shortest path lengths across the metabolic network between gene–metabolite pairs (Additional file 3: Table S5). d Null distribution of average shortest path lengths obtained after 10,000 permutations consisting of a random selection of 20 metabolites and 73 reactions. The Asns enzyme has two catalytic sites for two reactions, which are identified as Asns-A and Asns-B in this figure
