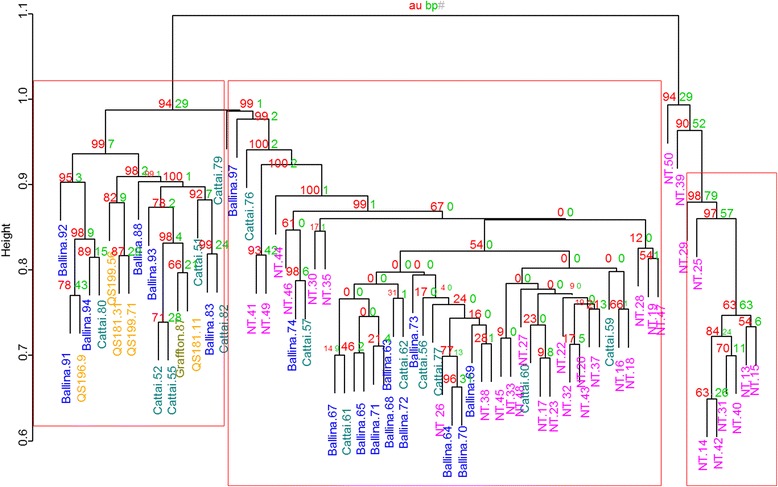
Fig. 2.

A dendogram showing the phylogenetic reconstruction based on filtered SNPs isolated from C. brevitarsis populations from two biogeographic regions of Australia. Numbers on inner branches represent P values calculated through multiscale bootstrap resampling. The red-colored P values represent the approximated unbiased (au) P values while the green P values represent the bootstrap probability (bp) P values (see main text for details). The red-framed clusters with AU p-value >/= 0.95 allow the rejection of an alternative hypothesis of non-existence of the clusters with a significance level of 0.05. The frame at the right contains only NT samples (pink); the left frame includes only East Coast samples (blue and green), with Queensland samples (yellow); and the central frame is constituted of mixed samples from the NT and the East Coast
