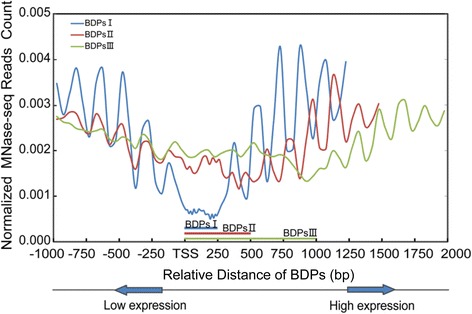
Fig. 5.

Profile of nucleosome positioning around each type of BDP. Profile of nucleosome positioning shown around type I BDPs (blue line),type II (red line) and type III (green line) BDPs extending ±1 kb from each BDPs. Bidirectional gene pairs with higher and lower FPKM values are aligned on the right and left side of BDPs, respectively. Normalized MNase-seq reads count representing the nucleosome positions were calculated by reads number per bp of genomic region per million reads. X-axes show the relative distances from the BDPs (bp); Y-axes show normalized MNase-seq reads counts (read number per bp of genome per million reads) within ±1 kb of the TSS. Paired-end MNase-seq reads were normalized and used for nucleosome positioning profiling. The bottom diagram indicates the direction of different expression levels from each gene pair: the gene with higher expression (higher FPKM values) is located on the right side and the gene with lower expression (lower FPKM values) is located on the left side
