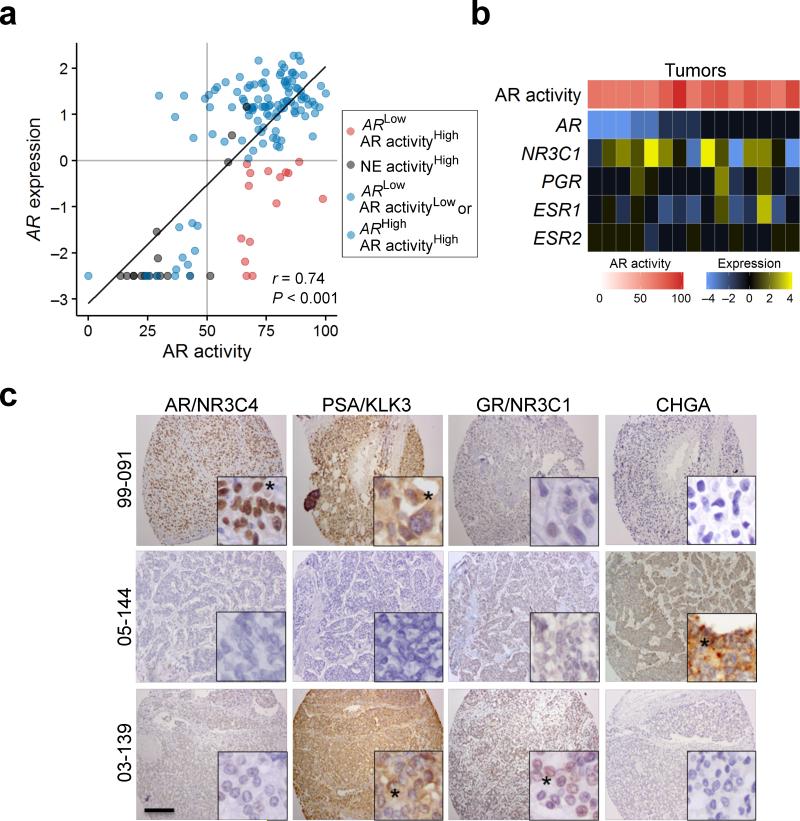
Figure 2. Relationships between AR activity and the expression of AR and other nuclear hormone receptors.
(a) The relationship between AR transcript expression plotted as mean centered log2 ratio to the AR activity score for each tumor. Blue points represent adenocarcinomas where AR activity levels correlate with AR level; black points are neuroendocrine tumors; red circles are tumors with high AR activity and relatively low AR expression. There was a positive overall correlation between AR transcript levels and AR activity score (r = 0.74, P < 0.001) using Pearson's correlation coefficient,
(b) Transcript levels of nuclear hormone receptors for the 15 tumors with high AR activity and low AR expression. NR3C1, glucocorticoid receptor; PGR, progesterone receptor; ESR1, estrogen receptor alpha, ESR2, estrogen receptor beta.
(c) Immunohistochemical assessment of AR (NR3C4), GR (NR3C1), PSA (KLK3) and chromogranin (CHGA) protein in mCRPC tumors from three men with different AR expression and AR activity relationships: 99-091 expresses AR and the AR regulated protein PSA while 03-139 lacks AR expression but expresses GR (NR3C1) and PSA (KLK3). Black asterisk indicates cells with positive staining. Black scale bar is 200 micrometers.

