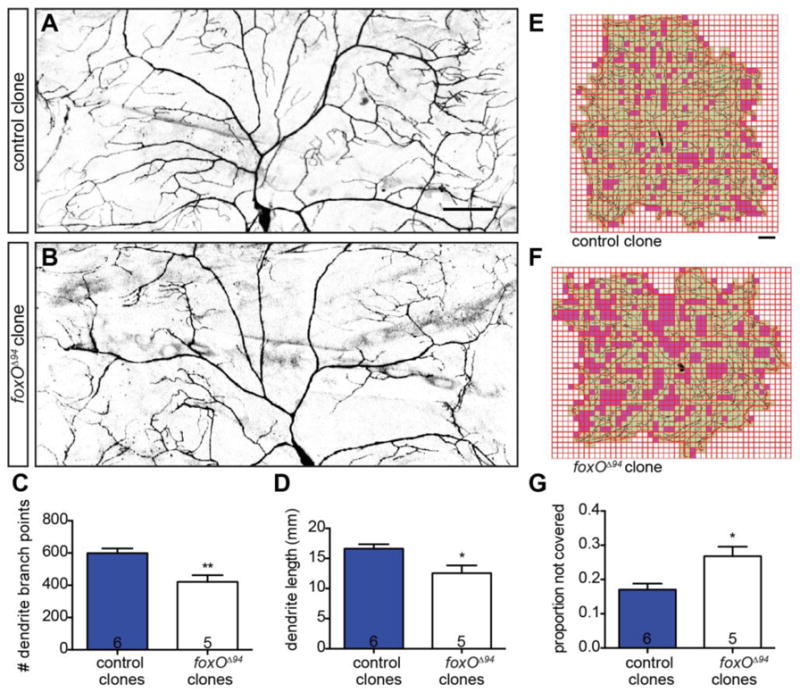
Figure 2. FoxO acts cell-autonomously to regulate class IV dendrite morphology.

(A–B) Representative z-projections of class IV ddaC MARCM clones at 120 h AEL of the indicated backgrounds marked with mCD8-GFP driven by 109(2)80-GAL4. (C) Quantification of dendrite branch point numbers in control clones: 598.7 ± 29.5, n=6 cells; foxOΔ94 clones: 420.8 ± 42.5, n=5 cells. (D) Quantification of dendrite length in control clones: 16.62 ± 0.73 mm, n=6 cells; foxOΔ94 clones: 12.56 ± 1.28 mm, n=5 cells. (E–F) Representative analysis of internal coverage of ddaC cells with 250 μm2 squares of the indicated backgrounds. Green squares mark areas covered by the dendritic arbor and soma, while magenta squares mark areas not covered. (G) Quantification of the proportion of squares not covered by the dendrite and soma in control clones: 0.17 ± 0.02, n=6 cells; foxOΔ94 clones: 0.27 ± 0.03, n=5 cells. Scale bars: 50 μm. Error bars are mean ± s.e.m., *, p<0.05, **, p<0.01.
